Financial KPIs Every Practice Manager Must Know (A CFO Framework for Running a Profitable Practice)
Healthcare and medspa profitability is not determined by patient volume alone — it is driven by utilization, provider productivity, pricing discipline, and cost control. Financial metrics such as operating expenses are critical for evaluating a company’s financial performance and identifying areas for improvement.
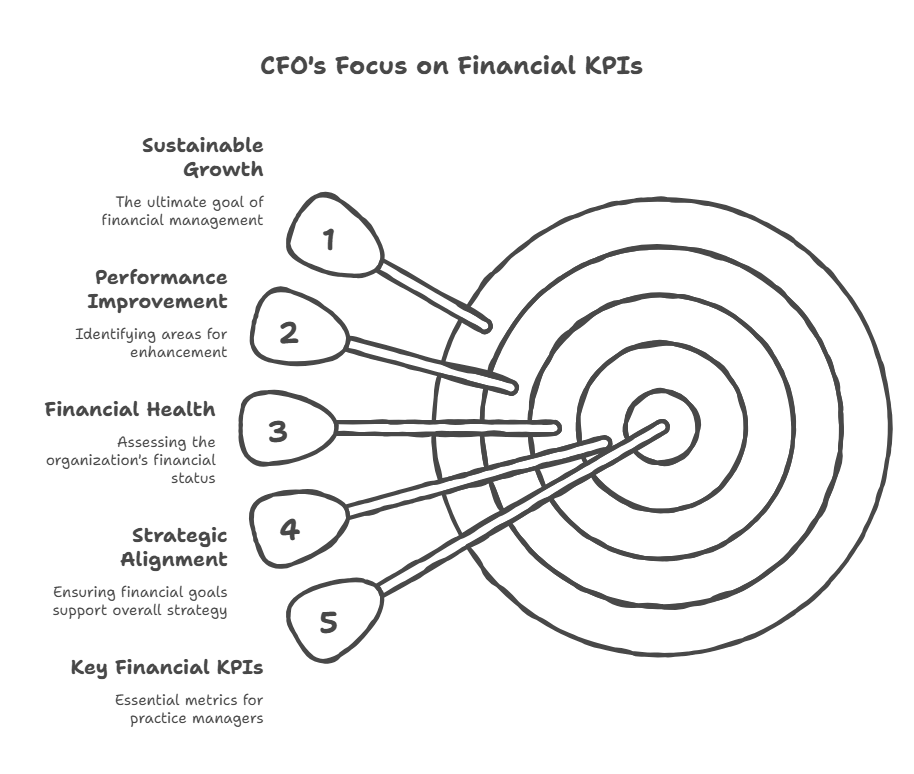
Practice managers who track the right financial KPIs gain visibility into revenue leakage, staffing inefficiencies, and scaling readiness.
Why Financial KPIs Matter for Financial Performance in Healthcare and Medspa Operations
In healthcare and aesthetic practices, financial performance is tightly connected to operational execution. Every appointment slot, provider hour, and treatment room represents potential revenue. When scheduling, staffing, or pricing misaligns, margin erosion follows quickly.
Unlike many industries, healthcare revenue is constrained by capacity. You cannot double revenue without increasing provider output, improving utilization, adjusting pricing, or expanding locations. Pricing strategies directly impact the company’s financial performance by influencing margins and revenue, making them a critical lever for optimizing profitability and supporting strategic business decisions. That makes operational KPIs inseparable from financial results.
For CFOs and practice managers, the goal is not simply higher collections — it is higher productivity per provider hour, improved patient retention, and controlled labor ratios that scale across multiple locations.
Understanding Key Financial Concepts
For CFOs and practice managers, mastering key financial concepts is the foundation of effective decision-making and sustainable growth. Metrics such as operating cash flow, net profit margin, and gross profit margin offer a window into a company’s financial health and operational efficiency. Operating cash flow reveals how much cash is generated from core business activities, while net profit margin and gross profit margin highlight how efficiently revenue is converted into profit at different stages of the income statement.
Another critical metric is the cash conversion cycle (CCC), which measures the time it takes to turn investments in inventory and other resources into cash flows from sales. A shorter cash conversion cycle means the business is able to quickly recover its outlays and reinvest in growth, while a longer cycle can signal inefficiencies or cash flow bottlenecks. By tracking these performance metrics, CFOs can pinpoint areas for improvement, optimize resource allocation, and develop strategies that enhance overall financial performance and resilience.
Cash Flow Management: Keeping Your Practice Liquid
Maintaining a healthy cash flow is essential for any practice aiming for long-term financial stability. Effective cash flow management ensures your company can meet its short-term obligations and continue day-to-day operations without disruption. CFOs should regularly review the cash flow statement to monitor both inflows and outflows, focusing on cash generated from core business operations.
Key performance indicators (KPIs) such as accounts payable turnover and accounts receivable turnover provide valuable insights into how efficiently your practice manages working capital. A strong cash balance and proactive management of accounts payable and receivable help safeguard liquidity and prevent cash crunches. By tracking these KPIs and optimizing working capital, practices can avoid liquidity crises, support ongoing investments, and maintain the financial health necessary for sustainable growth.
Accounts Payable and Payable Turnover: Managing Outflows Efficiently
Efficient management of accounts payable is a cornerstone of strong cash flow and financial stability. The accounts payable turnover ratio measures how quickly your company pays its suppliers, with a higher ratio indicating prompt payments and effective cash management. However, CFOs must strike a balance—paying suppliers too quickly can strain cash reserves, while delaying payments may harm supplier relationships.
Optimizing payable turnover allows your practice to conserve cash without jeopardizing essential partnerships. Monitoring the debt to equity ratio alongside accounts payable turnover helps ensure your company is not over-leveraged and maintains a healthy capital structure. By keeping a close eye on these metrics, CFOs can manage outflows strategically, support ongoing operations, and strengthen the company’s financial position.
Revenue per Provider Hour: The Core Productivity Metric
Revenue per provider hour is one of the most important financial indicators in any clinic or medspa. It measures how effectively licensed providers convert their available time into billable production.
If a provider is scheduled for 35 clinical hours per week but only generates revenue equivalent to 28 productive hours, the difference is hidden inefficiency. Empty slots, underpriced services, or excessive low-margin treatments reduce realized revenue per hour.
CFOs track this metric by provider and by service category, often using structured provider productivity modeling to connect clinical hours, utilization, and margin. Comparing current period revenue to prior period revenue helps identify trends and measure improvements in provider productivity.
High-performing practices benchmark revenue per hour against compensation models to ensure providers produce at multiples of their labor cost.
When revenue per hour trends downward, it signals scheduling friction, pricing pressure, or service mix imbalance.
Utilization Rate: Capacity vs. Performance
Utilization rate measures booked appointment time divided by available clinical time. In both medical and aesthetic environments, underutilization is one of the most common silent profit drains.
A clinic operating at 65% utilization may appear busy, yet it carries 35% unused capacity. Fixed costs such as rent, administrative payroll, and equipment leases remain constant regardless of appointment fill rates.
High-performing practices aim for 80–90% utilization depending on service type. CFOs monitor utilization by provider and by location. If utilization falls, leadership investigates scheduling gaps, marketing flow, cancellation rates, and front-desk processes.
Capacity discipline directly influences operating leverage.
Net Profit Margin and Contribution Margin by Service Line
Not all treatments are equally profitable. Some services drive volume but compress margins due to supply costs, discounting, or provider time intensity.
Contribution margin analysis isolates revenue minus direct variable costs — including provider compensation (if commission-based), consumables, treatment-specific supplies, and cost of goods sold as a key component of direct variable costs.
A medspa offering injectables, laser services, and skincare packages may find that injectables generate higher contribution per hour despite similar top-line revenue.
Practice managers must understand which services subsidize overhead and which dilute profitability. Service mix optimization is often a faster profit lever than increasing patient volume.
Labor Cost Ratio and Operating Cash Flow: The Largest Expense Driver
In most healthcare and aesthetic practices, labor represents 40–60% of revenue. This includes providers, support staff, and administrative personnel.
CFOs track labor cost as a percentage of revenue by location and in aggregate. If labor cost ratios rise without corresponding revenue growth, margin compresses quickly.
Overstaffing to “improve service” often backfires financially. Conversely, understaffing reduces patient experience and retention. The balance requires driver-based modeling tied to appointment volume and average revenue per visit.
Staffing decisions should be based on forecasted appointment flow, not reactive hiring.
Patient Acquisition Cost and Lifetime Value
In medspa and elective healthcare settings, marketing spend significantly influences profitability. Paid advertising, referral incentives, and promotional campaigns must generate patients whose lifetime value exceeds acquisition cost.
A disciplined practice tracks:
- Cost per new patient
- Average revenue per patient
- Retention rate
- Lifetime revenue per cohort
Practices may also analyze the annual growth rate CAGR of patient cohorts to assess long-term growth and retention trends.
If acquisition cost approaches first-visit revenue without strong retention, growth becomes unprofitable. CFOs analyze cohort behavior to ensure marketing investments generate repeat visits and package conversions.
Volume without retention destroys margin.
Cancellation and No-Show Rates
Few metrics impact profitability as directly as cancellation rates. Empty appointment slots cannot be recovered once time passes.
A 10% no-show rate in a clinic operating near capacity can reduce effective revenue per provider hour materially, which is why practices benefit from reducing no-shows using financial modeling and disciplined scheduling policies. Leading practices implement deposit policies, automated reminders, and waitlist management systems to reduce lost slots.
Financial dashboards should integrate cancellation data into revenue forecasts. Ignoring no-shows produces inflated budgeting assumptions.
Average Revenue per Visit and Pricing Discipline
Average revenue per visit reflects service bundling, upselling effectiveness, and pricing alignment. If visit revenue declines despite steady patient counts, margin compression is likely occurring.
Comparing actual revenue to budgeted revenue allows practice managers to calculate revenue budget variance and assess whether pricing and service mix are meeting financial targets.
Practice managers should evaluate pricing annually against competitive positioning and cost inflation. Many healthcare operators underprice services relative to market due to fear of patient churn.
CFOs model modest pricing adjustments to test revenue sensitivity. Often, small price increases have limited impact on demand but significantly improve contribution margin.
Multi-Location Performance Variance
As practices expand across locations, variance analysis becomes essential, and a well-designed multi-location healthcare dashboard becomes a critical tool for converting raw data into actionable insight. Revenue per provider hour, utilization, labor ratio, and contribution margin should be benchmarked consistently.
Underperforming clinics may reveal scheduling inefficiencies, leadership gaps, or demographic differences. Without standardized KPI tracking, multi-location scaling becomes fragmented.
Financial standardization allows operators to replicate best practices and identify lagging indicators early. Consolidating financial data and tracking cash flow across all locations is critical to ensure consistent performance measurement and effective financial management.
Finance Team and Leadership: Building Financial Accountability
A high-performing finance team is vital for driving financial accountability with KPIs and supporting business growth. CFOs play a key leadership role by fostering a culture of transparency, data-driven decision-making, and continuous improvement within the finance team. Tracking key performance indicators (KPIs) such as revenue growth rate, net income, and free cash flow (FCF) enables finance leaders to assess financial performance, identify trends, and address areas needing attention.
Regular financial updates and in-depth analysis empower the finance team to make informed decisions that align with the company’s strategic objectives. Effective financial leadership also involves developing robust financial strategies—such as optimizing capital structure, managing risk, and improving operational efficiency—to ensure the company’s long-term success. By prioritizing these CFO KPIs and building a strong finance team, organizations can achieve greater financial discipline and unlock new opportunities for growth.
Common Mistakes That Reduce Profitability
Many practice managers focus exclusively on top-line collections without evaluating efficiency ratios. Others fail to separate provider productivity from overall clinic performance, masking underperformance.
Another common mistake is inconsistent data definitions across locations. If one clinic measures utilization differently from another, comparisons become unreliable.
Finally, many practices forecast revenue based solely on historical growth without integrating scheduling capacity or staffing constraints. Growth projections must tie directly to provider availability and patient flow assumptions.
Effective risk management involves integrating scenario planning and forecasting to anticipate and mitigate potential financial challenges.
Frameworks That Support Financial Discipline
High-performing healthcare operators rely on driver-based financial models that connect appointment volume, provider hours, service mix, and pricing to projected revenue, ensuring that each new location or provider is added within a coherent healthcare practice scalability framework.
Rolling forecasts allow leadership to adjust staffing or marketing proactively. Scenario analysis models the financial impact of adding a new provider, adjusting hours, increasing marketing spend, or expanding treatment rooms.
Dashboards consolidate key metrics across providers and locations, surfacing trends in utilization, margin, and labor efficiency. CFO key performance indicators are central to these dashboards and support data-driven decision-making.
Operational visibility drives financial control.
Practical Example: Unlocking Hidden Capacity
A multi-provider medspa generating $4.5M annually believed growth required adding two new providers. Financial review revealed utilization averaging 68%, with cancellation rates near 12%.
After implementing reminder systems, adjusting scheduling blocks, and optimizing service bundling, utilization increased to 83% within four months. Revenue per provider hour rose 14%. The clinic achieved 18% revenue growth without hiring additional staff.
The constraint was not demand. It was operational inefficiency. By improving operational efficiency and increasing utilization, the clinic effectively extended its cash runway, allowing for sustainable growth without immediate additional investment.
Best Practices
Healthcare and medspa operators should standardize financial definitions and reporting assumptions across locations and implement a focused set of medspa KPIs for high-margin practices to keep teams aligned on the right targets. KPIs must directly influence utilization, revenue per provider hour, labor ratio, and contribution margin.
Standardizing accounts receivable processes and tracking KPIs such as days sales outstanding and average accounts receivable can help practices improve collections and cash flow management.
Driver-based forecasting models should guide staffing and expansion decisions. Scenario planning should evaluate pricing adjustments, marketing increases, or provider additions before execution. Dashboards must highlight performance variances across providers and clinics to support informed management decisions.
Financial discipline enables operational excellence.
Conclusion
This article supports healthcare and medspa founders, CFOs, and operators in mastering essential financial concepts that influence revenue growth, operating leverage, and long-term scalability.
Sustainable practice growth does not come from volume alone. It comes from disciplined utilization management, pricing strategy, labor efficiency, and data-driven forecasting. The practices that scale successfully are those that treat financial KPIs as operating tools — not retrospective reports.
CFOs should monitor a range of KPIs, including current ratio, current assets, current liabilities, liquid assets, how much net income, how much profit, financial leverage, shareholders equity, and compound annual growth rate, to ensure comprehensive financial oversight.
