Top KPIs for Medspa Owners (A CFO Framework for Running a High-Margin, Scalable Practice)
TL;DR: Most medspa owners track revenue, new patients, and online reviews — but those metrics don’t tell you whether the business is scalable, efficient, or profitable. The real drivers of medspa performance are provider utilization, revenue per clinical hour, consumables margin, room efficiency, retention, and the economics of memberships. When we implement a KPI system, practices typically improve EBITDA 8–20% within the first year, without adding providers or spending more on marketing.
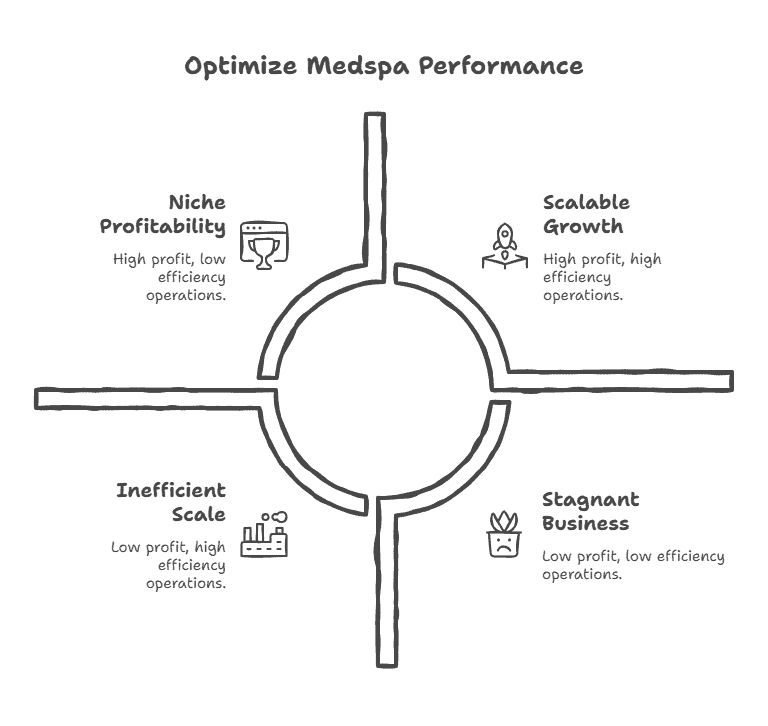
Most medspa owners diligently track revenue, new patient counts, and online reviews. However, these surface-level metrics fail to reveal whether a business is truly scalable, efficient, or profitable. The authentic drivers of medspa performance—and the keys to unlocking long-term growth—are provider utilization, revenue per clinical hour, consumables margin, room efficiency, retention, and the nuanced economics of membership programs.
To elevate business performance, it is essential to monitor the critical KPIs that reflect the operational, financial, and marketing health of your enterprise. When we implement a robust KPI system, practices typically realize an EBITDA improvement of 8–20% within the first year, achieved without adding providers or increasing marketing spend.
Why Most Medspas Track the Wrong KPIs
When assuming FP&A or Fractional CFO responsibilities for a medspa, we often find dashboards dominated by:
-
Total monthly revenue
-
Total new patient counts
-
Social media followers
-
Volume of treatments performed
-
Average ticket value
-
Five-star reviews
While these metrics aren’t “wrong,” they are insufficient for managing a clinical, capacity-driven, cash-based business. They overlook essential data points required for a scalable model. The core issues we consistently identify include:
-
Lack of Clarity: No insight into which providers or services are actually profitable.
-
Disconnected Data: No link between schedule utilization and profit margins.
-
Acquisition Bias: Overreliance on new patients rather than maximizing lifetime value (LTV).
-
Margin Erosion: Membership structures that decrease profit instead of stabilizing it.
-
Menu Bloat: An overextended service list that dilutes operational throughput.
-
Cost Creep: Zero visibility into the rising cost of consumables.
-
Time Blindness: No monitoring of actual task duration versus scheduled time.
Many medspas experience year-over-year revenue growth while their margins stagnate or decline. This occurs because they aren’t tracking the specific KPIs that drive profit.
The 12 Most Important KPIs for Medspa Owners
We categorize the essential KPI set for multi-location medspas and aesthetic practices into four pillars:
1. Capacity & Provider Performance
-
Provider Utilization
-
Revenue per Clinical Hour
-
Room Utilization
-
Schedule Density / Gap Rate
2. Revenue & Margin Economics
-
Contribution Margin by Service
-
Consumables % of Revenue
-
Pre-Paid vs. Earned Revenue Ratio
-
EBITDA per Provider / per Room
3. Patient Acquisition & Retention
-
New-to-Returning Patient Ratio
-
Rebooking Rate
-
Patient Lifetime Value (LTV)
4. Membership Performance
-
Membership Margin & Breakage Rate
Deep Dive: Definitions, Formulas, and Benchmarks
1. Provider Utilization (The Primary Profit Predictor)
This is the most significant indicator of medspa profitability.
-
Target: 75–85%
-
Below 60%: Underutilization / inefficient staffing.
-
Above 90%: Provider burnout risk and scheduling bottlenecks.
High utilization supports increased revenue without additional marketing spend. We track this weekly to fix issues via schedule optimization, better slot templates, and shifting lower-value services off peak hours.
2. Revenue per Clinical Hour (The Productivity Benchmark)
This metric determines if your team’s time is being utilized for high-value tasks.
-
RN/Aesthetician: $350–$650/hr
-
NP/PA Injectors: $600–$1,200/hr
-
Elite Injectors: $1,200–$2,000/hr
If a high-skill provider is performing low-value services, this metric catches it instantly, allowing you to realign productivity with financial targets.
3. Room Utilization (The Hidden Bottleneck)
In many practices, rooms—not providers—are the true constraint.
-
High Performance: 70–85%
-
Underperforming: < 55%
Low utilization often points to poor provider-room pairing, underperforming modalities, or inefficient appointment templates.
4. Schedule Density / Gap Rate
Gap rate measures the schedule fragmentation caused by unbookable “dead air.”
-
Best-in-Class: < 10%
-
Common Industry Average: 20–35%
Small 10-to-15-minute gaps across multiple providers result in hundreds of lost hours annually. Reducing these gaps maximizes client visit value and boosts retention.
5. Contribution Margin by Service
Revenue is a vanity metric; contribution margin is the reality.
-
Injectables: 55–75%
-
Facials: 40–60%
-
Body Contouring: 20–40% (Often lower)
Most owners discover that 20–40% of their menu actually destroys margin. This KPI is the starting point for service-menu restructuring.
6. Consumables % of Revenue (The Silent Margin Killer)
Toxins, fillers, and disposables can quietly inflate your Cost of Goods Sold (COGS).
-
Injectables: 22–40%
-
Facials/Peels: 15–30%
-
Laser/Equipment: 5–20%
In high-volume practices, every 1% reduction in consumables cost can add $80k–$150k to EBITDA annually.
7. Pre-Paid vs. Earned Revenue Ratio
Gift cards and prepaid packages can distort your financial health.
-
Healthy Range: 0.6–1.2 months of prepaid revenue.
A medspa can show record revenue while having a negative margin if the “burn” of prepaid services outweighs the cash coming in.
8. EBITDA per Provider / per Room
The ultimate investor lens for valuation and scaling.
-
EBITDA per Provider: $150k–$350k
-
EBITDA per Room: $120k–$250k
9. New-to-Returning Patient Ratio
While acquisition is necessary, retention is more profitable.
-
Healthy Mature Practice: 20–35% New
-
Growth Mode: 35–50% New
-
Red Flag: > 60% New (Indicates a retention problem)
10. Rebooking Rate
This is your most predictive indicator of future revenue stability.
-
Injectables/Lasers: 70–90%
-
Facials: 60–80%
11. Patient Lifetime Value (LTV)
LTV connects marketing costs (CAC) to long-term unit economics.
-
Typical Range: $1,200–$6,500+
12. Membership Margin & Breakage Rate
Memberships should be profit engines, not subsidies. We track:
-
Membership Gross Margin: Revenue minus cost of services and discounts.
-
Utilization vs. Entitlement: Monitoring if members over-utilize high-cost services.
-
Breakage Rate: The percentage of benefits not redeemed (Healthy: 18–35%).
Strategic Synthesis: How KPIs Create a Unified Story
These metrics do not exist in isolation. Provider utilization and revenue per hour drive EBITDA per provider, while room utilization exposes physical bottlenecks. Contribution margin identifies the winners on your menu, while rebooking and LTV dictate your marketing requirements.
Once tracked, most medspas uncover:
-
15–25% of services are underpriced.
-
10–20% of schedule time is wasted.
-
Excess discounting is hidden within memberships.
Case Study: 3-Location Medspa ($9.2M Revenue)
Before KPI Implementation:
-
Provider Utilization: 52%
-
Consumables Cost: 34%
-
EBITDA Margin: 11%
After KPI Infrastructure (9 Months Later):
-
Provider Utilization: 78%
-
Consumables Cost: 27%
-
Rebooking: 42% → 71%
-
Service Menu: 61 → 28 offerings
-
EBITDA Margin: 22%
The Result: Doubled profitability with no new providers, no new equipment, and no additional rooms.
Strategic CFO Insights
-
Most medspas have a scheduling and margin problem, not a revenue problem.
-
Provider utilization is the strongest driver of EBITDA.
-
Memberships must be managed as financial products.
-
Retention is always more valuable than acquisition spend.
-
Multi-site operators must obsess over EBITDA per room/provider.
FAQ
-
Tracking Frequency? Weekly for utilization/schedules; Monthly for financials; Quarterly for LTV/Memberships.
-
Provider Dashboards? Absolutely. Accountability for utilization, rebooking, and ticket average motivates staff.
-
Fastest Profit Lever? Provider utilization. Optimizing the schedule alone can boost EBITDA by 15%+.
