How to Analyze CPG Customer Profitability (A CFO Playbook for Account-Level Financial Truth)
TL;DR: Most CPG brands know their overall gross margin but have no idea which retail, distributor, Amazon, or DTC customers actually make money. Customer profitability varies widely because of promo frequency, trade spend, freight cost, chargebacks, shrink, DC inefficiency, and true net pricing. A CFO-grade customer-level profitability model reveals which accounts drive profitable growth and which destroy cash. This is one of the highest ROI analytics exercises in CPG finance.
The $2.4 Million Question: Which Customers Make Money?
Last year, we worked with a natural foods brand generating $6.8M in annual revenue across 47 retail and distributor customers. Their overall financial performance looked healthy: 36% gross margin, 11% EBITDA, growing 28% year-over-year. The CEO was confident the business was scaling profitably.
Then we built a customer-level profitability model.
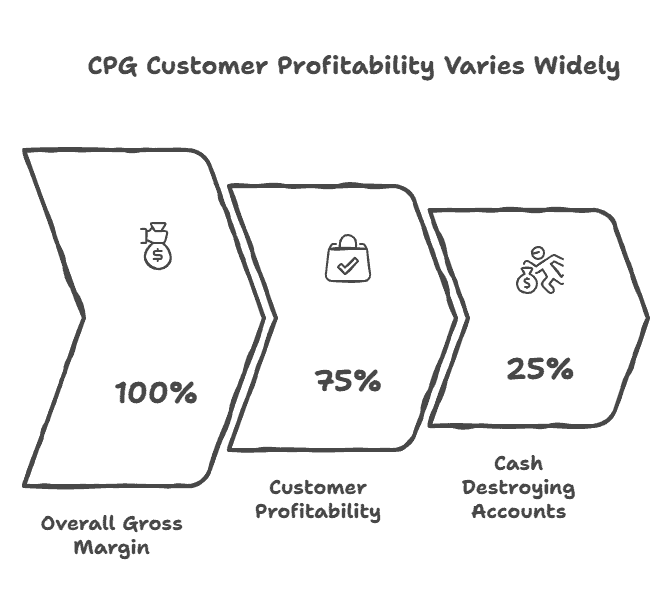
The analysis revealed a devastating reality: 12 customers (26% of customer count) generated 88% of total contribution margin. Another 22 customers (47% of customer count) were marginally profitable, contributing 14% of total margin. The remaining 13 customers (27% of customer count) were actively losing money, consuming 2% of total contribution margin.
Digging deeper:
Customer A (Regional Natural Chain): $380,000 annual revenue, $147,000 contribution margin (38.7% margin) — Highly profitable, efficient ordering, reasonable trade spend, strong velocity.
Customer B (Conventional Grocery Chain): $520,000 annual revenue, $78,000 contribution margin (15.0% margin) — Marginally profitable due to heavy trade spend requirements and frequent chargebacks.
Customer C (Small Regional Distributor): $140,000 annual revenue, -$11,000 contribution margin (-7.9% margin) — Money-losing due to small order sizes (high freight cost per case), frequent returns, and slow payment.
The brand was investing equal sales and operations resources across all customers, treating $380K customer A the same as $140K customer C, despite customer A generating $147K in profit while customer C lost $11K.
Strategic reallocation followed immediately:
– Exited 8 unprofitable customers (including Customer C), eliminating $63K in annual losses
– Reallocated sales resources to top 12 profitable accounts
– Implemented minimum order requirements and shipping fees for remaining small accounts
– Doubled down on expanding distribution with Customer A’s parent company
Result: Revenue declined 11% (from cutting unprofitable volume) but EBITDA improved from 11% to 16.5%. Profitability improved by 50% while freeing up sales and operations capacity to pursue higher-quality growth.
This is why customer-level profitability analysis is the highest-ROI finance exercise in CPG. It reveals where you’re making money (invest more) and where you’re losing money (restructure or exit).
The True Cost to Serve Framework
Standard CPG gross margin calculations miss 60–70% of customer-specific costs. True customer profitability requires calculating “cost to serve” — all incremental costs incurred to support each specific customer.
Layer 1: Net Net Pricing (True Revenue After All Deductions)
Start with true net revenue after every deduction, discount, and allowance:
Gross invoiced revenue: $100,000
Less: Off-invoice discounts (6%): -$6,000
Less: Billback promotional allowances (4%): -$4,000
Less: Slotting fees (amortized monthly): -$1,200
Less: Marketing co-op (3%): -$3,000
Less: Damage/shrink allowances (2%): -$2,000
Less: Compliance chargebacks (1.5%): -$1,500
Net net revenue: $82,300
Your “net revenue” is 82.3% of gross invoiced amount. Many brands stop at $94,000 (after off-invoice discounts) and overstate revenue by $11,700 per $100K in gross sales. This 12% error compounds into massive profitability misstatements at customer level.
Layer 2: Customer-Specific COGS
COGS varies by customer based on order patterns, SKU mix, and production efficiency.
Calculate customer-specific COGS:
Standard COGS per unit: $2.15
Customer A orders: 80% Flavor X ($2.05 COGS), 20% Flavor Y ($2.45 COGS)
Customer A blended COGS: $2.13 per unit
Customer B orders: 30% Flavor X, 70% Flavor Y
Customer B blended COGS: $2.34 per unit
A customer ordering expensive SKUs has 10% higher COGS than a customer ordering efficient SKUs. This difference compounds across thousands of units into material profitability gaps.
Layer 3: Freight and Logistics Costs
Freight cost per case varies dramatically by customer based on distance, order size, and delivery frequency.
Customer freight analysis:
| Customer | Distance (miles) | Avg Order Size (cases) | Deliveries / Month | Cost per Case ($) | Monthly Freight ($) |
| Customer A | 280 | 1,200 | 2 | 2.85 | 6,840 |
| Customer B | 520 | 350 | 4 | 7.20 | 10,080 |
| Customer C | 180 | 2,400 | 2 | 2.10 | 10,080 |
Customer B pays 2.5x higher freight per case than Customer C due to small order sizes and long distances. Despite similar monthly freight spend ($10K), Customer B receives 1,400 cases while Customer C receives 4,800 cases — meaning Customer B’s freight cost per unit is 3.4x higher.
Calculate customer-specific freight burden:
Customer A monthly volume: 2,400 cases
Customer A monthly freight: $6,840
Customer A freight per case: $2.85
Customer B monthly volume: 1,400 cases
Customer B monthly freight: $10,080
Customer B freight per case: $7.20
This $4.35 per case difference (on 24-unit cases) equals $0.18 per unit — enough to shift a customer from 25% contribution margin to 18% contribution margin.
Layer 4: Trade Spend and Promotional Costs
Beyond contractual trade spend (slotting, co-op), customers vary in promotional intensity and associated costs.
Promotional cost analysis:
| Customer | Promo Frequency | Avg Discount Depth | TPR Cost per Unit ($) | Demo Events | Total Promo Cost ($) |
|---|---|---|---|---|---|
| Customer A | 2× per year | 15% | 0.42 | 4 events | 18,500 |
| Customer B | 6× per year | 22% | 0.87 | 12 events | 45,200 |
Customer B promotes 3x more frequently at deeper discounts, costing $0.45 more per unit sold in promotional support. On 60,000 annual units, that’s $27,000 higher promotional cost for the same volume.
Factor in demo events and sampling:
– Demo event cost: $850 per event (labor, product, materials)
– Customer A: 4 events = $3,400 annually
– Customer B: 12 events = $10,200 annually
Customer B requires $6,800 more promotional support despite similar volume.
Layer 5: Returns, Damages, and Shrink
Customer returns policies, handling practices, and damage rates vary significantly.
Returns and damage analysis:
| Customer | Return Rate | Damage Rate | Monthly Volume | Monthly Returns | Monthly Damages | Total Loss |
| Customer A | 0.5% | 1.2% | 2,400 cases | 12 cases | 29 cases | ($1,640) |
| Customer D | 4.2% | 5.8% | 1,800 cases | 76 cases | 104 cases | ($7,200) |
Customer D’s 10% combined return/damage rate costs $7,200 monthly vs. Customer A’s $1,640 — an $5,560 monthly difference ($66,720 annually). On $240,000 annual revenue from Customer D, returns and damages consume 28% of gross margin.
High return/damage customers often have:
– Poor warehouse handling procedures
– Inadequate climate control
– Aggressive return policies that encourage retailer over-ordering
– Long shelf-time in their distribution system
– Weak inventory management causing product to age
Layer 6: Payment Terms and Working Capital Costs
Customers with long payment cycles consume working capital that has real costs.
Working capital analysis:
| Customer | Payment Terms | Actual Days to Pay | Working Capital Required | Cost of Capital (8%) |
|---|---|---|---|---|
| Customer A | Net 30 | 32 days | $32,000 | $2,560 annually |
| Customer E | Net 60 | 78 days | $78,000 | $6,240 annually |
Customer E’s slow payment requires 2.4x more working capital deployment. At 8% cost of capital, this adds $3,680 annual cost vs. Customer A — equivalent to 1.5% of revenue for a customer generating $250K annually.
Late payment also creates operational friction:
– Collections effort and time
– Cash flow planning complexity
– Increased financial risk
– Strained relationships
Layer 7: Account Management and Support Costs
High-touch customers require disproportionate sales and operations resources.
Resource intensity analysis:
| Customer | Monthly Sales Calls | Planning Meetings | Issue Resolution Time | Monthly Labor Cost |
|---|---|---|---|---|
| Customer A | 2 calls | 1 quarterly | 2 hours/month | $800 |
| Customer F | 8 calls | 2 monthly | 15 hours/month | $3,200 |
Customer F consumes 4x more sales and operations resources despite similar revenue. On $300K annual revenue, the $28,800 additional labor cost equals 9.6% of revenue — often exceeding the customer’s entire contribution margin.
High-maintenance customers often have:
– Complex ordering processes
– Frequent urgent requests
– Poor communication and planning
– Unrealistic expectations
– Operational inefficiencies that become your problem
Building the Customer Profitability Model
Integrate all seven cost layers into a comprehensive customer P&L.
Customer A (High-Profit Example):
| Line Item | Monthly | Annual | % of Net Revenue |
|---|---|---|---|
| Gross invoiced revenue | $35,200 | $422,400 | 110.2% |
| Less: Discounts and deductions | -$3,520 | -$42,240 | -11.0% |
| Net net revenue | $31,680 | $380,160 | 99.2% |
| Less: COGS | -$15,840 | -$190,080 | -49.6% |
| Gross margin | $15,840 | $190,080 | 49.6% |
| Less: Freight | -$570 | -$6,840 | -1.8% |
| Less: Trade/promo costs | -$1,540 | -$18,480 | -4.8% |
| Returns/damages | -$137 | -$1,644 | -0.4% |
| Less: Working capital cost | -$213 | -$2,556 | -0.7% |
| Less: Account mgmt labor | -$67 | -$800 | -0.2% |
| Customer contribution margin | $13,313 | $159,760 | 41.7% |
Customer A generates 41.7% contribution margin — highly profitable and efficient.
Customer D (Low-Profit Example):
| Line Item | Monthly | Annual | % of Net Revenue |
|---|---|---|---|
| Gross invoiced revenue | $22,500 | $270,000 | 112.5% |
| Less: Discounts and deductions | -$4,050 | -$48,600 | -20.3% |
| Net net revenue | $18,450 | $221,400 | 92.3% |
| Less: COGS | -$10,800 | -$129,600 | -54.0% |
| Gross margin | $7,650 | $91,800 | 38.3% |
| Less: Freight | -$1,260 | -$15,120 | -6.3% |
| Less: Trade/promo costs | -$3,150 | -$37,800 | -15.8% |
| Less: Returns/damages | -$600 | -$7,200 | -3.0% |
| Less: Working capital cost | -$520 | -$6,240 | -2.6% |
| Less: Account mgmt labor | -$267 | -$3,200 | -1.3% |
| Customer contribution margin | $1,853 | $22,240 | 9.3% |
Customer D generates only 9.3% contribution margin — barely profitable despite similar revenue to Customer A. The 32 percentage point margin gap (41.7% vs. 9.3%) represents $137,520 in annual profit difference between these similar-sized accounts.
Interpreting Customer Profitability Results
Once you’ve calculated customer-level profitability, segment customers into strategic categories.
Tier 1: Strategic Partners (>35% contribution margin)
These customers drive profitable growth and deserve maximum investment:
– Prioritize distribution expansion with these accounts
– Invest in joint business planning
– Offer preferential terms for volume commitments
– Dedicate senior sales resources
– Collaborate on innovation and new products
Example: Customer A at 41.7% margin — expand from 85 stores to 200+ stores, potentially adding $400K high-margin revenue.
Tier 2: Core Accounts (20–35% contribution margin)
Solid profitability but room for optimization:
– Maintain current relationships
– Identify margin improvement opportunities (reduce trade spend, improve freight efficiency)
– Cautiously expand distribution
– Monitor for margin erosion
Example: Customer B at 28.2% margin — negotiate improved freight terms through consolidation, potentially improving margin to 31%.
Tier 3: At-Risk Accounts (10–20% contribution margin)
Marginal profitability requiring active management:
– Restructure terms to improve economics (minimum orders, freight charges, reduced trade spend)
– Consider selective distribution reduction
– Flag any margin deterioration for immediate action
– Don’t invest in growth until margins improve
Example: Customer D at 9.3% margin — implement minimum order size of 600 cases to improve freight efficiency, potentially improving margin to 14%.
Tier 4: Unprofitable Accounts (<10% contribution margin or negative)
These accounts destroy value and should be exited or radically restructured:
– Present new terms requiring dramatic improvement
– Exit if terms aren’t accepted
– Reallocate sales resources to Tier 1 and Tier 2 accounts
– Don’t be sentimental — unprofitable revenue is worse than no revenue
Example: Customer C at -7.9% margin — exit immediately, eliminating $11,000 annual loss and freeing sales capacity.
Using Customer Profitability for Strategic Decisions
Decision 1: Sales Compensation Realignment
Traditional approach: Pay sales reps based on gross revenue growth.
Customer profitability approach: Weight compensation toward contribution margin dollars, not revenue dollars.
Current compensation: 2% of gross revenue
Revised compensation: 4% of contribution margin dollars
Under the old system, a rep generating $500K in revenue from low-margin accounts earns $10,000. Under the new system, if that revenue generates only $40K contribution margin (8%), the rep earns $1,600.
Meanwhile, a rep generating $400K in revenue from high-margin accounts (40% contribution margin = $160K) earns $6,400 under the new system vs. $8,000 under the old system.
The new system incentivizes pursuing high-quality revenue over volume.
Decision 2: Distribution Expansion Prioritization
Company evaluating three expansion opportunities:
Option A: Expand Customer A (41.7% margin) from 85 stores to 225 stores
Incremental revenue: $700,000
Incremental contribution margin: $291,900
Option B: Expand Customer B (28.2% margin) from 120 stores to 300 stores
Incremental revenue: $900,000
Incremental contribution margin: $253,800
Option C: Launch Customer G (unknown margin, expect 15% based on similar accounts) in 150 stores
Incremental revenue: $480,000
Incremental contribution margin: $72,000
Traditional prioritization: Choose Option B (highest revenue)
Customer profitability prioritization: Choose Option A (highest contribution margin dollars), despite lower revenue.
Decision 3: Promotional Calendar Optimization
Customer B runs 6 promotions annually at 22% discount depth, costing $45,200 in promotional support for $520,000 revenue (8.7% promo cost rate).
Customer A runs 2 promotions annually at 15% discount depth, costing $18,500 for $380,000 revenue (4.9% promo cost rate).
Analysis shows Customer B’s frequent deep promotions don’t drive incremental velocity — they just shift timing of purchases. Customers wait for deals rather than buying at full price.
Decision: Negotiate with Customer B to reduce promotional frequency from 6x to 3x annually, maintaining absolute promotional spending ($45K) but applied to fewer, better-planned events. This frees up $22,500 to invest in Customer A expansion promotions that drive true incremental trial.
Decision 4: Working Capital Optimization
Customer E pays in 78 days vs. 32-day terms. On $250K annual revenue, this requires $46,000 additional working capital (difference between 32 and 78 days).
At 8% cost of capital, this costs $3,680 annually. But offering 2% early payment discount (2/10 net 60) might encourage faster payment. If Customer E pays in 10 days to capture 2% discount, you lose $5,000 in discount but save $3,680 in working capital cost and eliminate 68 days of payment risk.
Net cost: $1,320
Benefit: Improved cash flow predictability, reduced DSO, eliminated collection effort
Decision: Offer early payment discount to chronic slow-payers, selectively using discounts as cash flow management tool.
Common Customer Profitability Mistakes
Mistake 1: Using Revenue as Proxy for Profitability
Revenue-based thinking: “Our top 10 customers by revenue deserve our best resources.”
Reality: Top 10 by revenue might include unprofitable accounts that should be exited.
Correct approach: Rank customers by contribution margin dollars, not revenue. The customer generating $180,000 contribution margin on $400K revenue is more valuable than the customer generating $120,000 contribution margin on $600K revenue.
Mistake 2: Ignoring Scale Efficiencies
Marginal profitability analysis: “Customer F is only 12% margin, we should exit.”
Reality: Customer F might improve to 22% margin if volume doubled due to freight and trade spend leverage.
Correct approach: Calculate scenario-based profitability at different volume levels. If Customer F at 2x volume would generate 22% margin, focus on growth before considering exit.
Mistake 3: Averaging Customer Costs
Averaging approach: “Our average freight cost is $3.50/case, apply to all customers.”
Reality: Customer freight ranges from $2.10 to $8.20 per case based on distance and order size.
Correct approach: Calculate customer-specific costs for freight, trade spend, returns, and working capital. Averages obscure the profitability variations that drive decisions.
Mistake 4: Not Updating Profitability Models
Static analysis: Built customer profitability once in 2023, never updated.
Reality: Customer economics change continuously due to velocity shifts, promotional changes, and deduction trends.
Correct approach: Update customer profitability quarterly as part of QBR process. Monthly for top 10 customers. Trigger immediate re-analysis when major terms change or performance deteriorates.
Mistake 5: Fearing Difficult Customer Conversations
Avoidance: “Customer C is unprofitable but they’re our oldest account, we can’t exit.”
Reality: Unprofitable customers drain resources and capital that could build profitable relationships. Sentimentality destroys shareholder value.
Correct approach: Present data-driven restructuring proposals. If customers won’t accept terms that create mutual profitability, exit professionally. Most customers respect transparent economics more than hidden resentment.
FAQ: Customer Profitability Analysis
How many customers should we analyze individually?
Analyze top 80% of revenue individually (often 15–25 customers). Aggregate remaining small customers into “Other” category. Complete individual analysis for any customer you’re considering expanding or any customer approaching unprofitability.
What if we don’t have customer-specific data on returns, damages, and freight?
Start with company averages, then refine over 3–6 months. Track customer-specific returns and damages going forward. Allocate freight based on distance and order size using transportation management data. Imperfect customer profitability is better than no customer profitability.
Should we share profitability analysis with customers?
Selectively, yes. When proposing restructured terms (minimum orders, freight charges, reduced trade spend), showing data builds credibility. Most retail buyers respect transparent economics. Don’t share absolute margin numbers, but share relative cost to serve comparisons.
How do we handle customers that are strategically important but currently unprofitable?
Calculate breakeven scenarios: “At what volume does Customer F become profitable?” If 2x volume creates 18% margin, pursue growth. If 3x volume only creates 8% margin, the relationship is structurally unprofitable — exit or radically restructure.
What customer profitability level should we target?
Target 25–40% contribution margin for core accounts. Below 15% requires restructuring. Below 10% typically requires exit. Above 45% suggests potential underpricing or exceptional strategic value (protect these accounts religiously).
How does customer profitability relate to customer lifetime value?
Customer profitability is annual economics. Customer lifetime value projects profitability across multi-year relationship. High annual profitability × high retention = exceptional LTV. Focus first on annual profitability, then extend to LTV for strategic accounts.
Should we exit unprofitable customers immediately?
Attempt restructuring first: present minimum order sizes, freight charges, reduced trade spend, or improved payment terms. Give 60–90 days to adjust. If they won’t accept mutually profitable terms, exit professionally with proper notice.
What if customer profitability shows we need to exit our largest customer?
If your largest customer is structurally unprofitable, you have a business model problem, not a customer problem. Before exiting, explore: (1) price increases, (2) SKU mix shifts to higher-margin products, (3) operational efficiency improvements, (4) trade spend renegotiation. If none work, controlled exit is better than slow value destruction.
How do we use customer profitability in new customer negotiations?
Set minimum acceptable terms based on profitability models: minimum order sizes, freight policies, payment terms, trade spend caps. If a prospect won’t meet minimum terms, decline the business. Unprofitable growth destroys companies — walk away from bad deals.
What tools do we need for customer profitability analysis?
Minimum: ERP with customer-level transaction data, transportation management data, trade promotion management. Ideal: Dedicated customer profitability analytics platform that automates data integration and updates quarterly. Excel works until $5M revenue, then automation becomes necessary.
