How to Reduce No-Shows Using Financial Modeling (A CFO Framework for Turning Lost Appointments into Profit)
Most practices treat no-shows as an operational nuisance. They call to reschedule and move on. But no-shows are a financial problem with measurable EBITDA impact, and the average practice is losing far more than the face value of the missed appointment. A 10% no-show rate can destroy 15 to 25% of potential profit. Using driver-based financial modeling, practices can quantify the true cost, implement targeted interventions, and recover 3 to 7 points of EBITDA that are currently evaporating unnoticed.
The average no-show rate in primary care ranges from 5% to 15%, and in elective and aesthetic practices, it often runs higher. Understanding the full financial weight of that figure is the first step toward addressing it systematically.
The Real Cost of a No-Show: Why It Exceeds the Appointment Value
When a patient does not show, most practices record the missed revenue and stop there. But the true cost of a no-show is materially higher than the appointment fee alone.
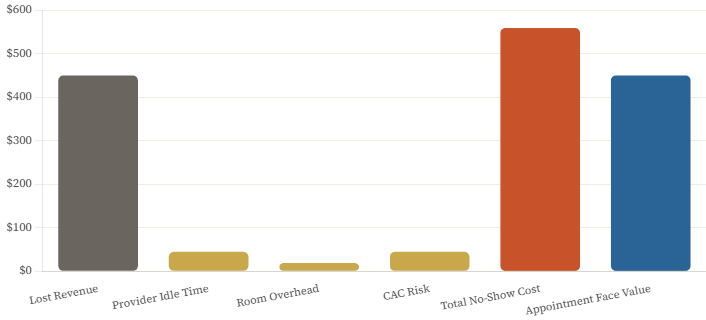
The direct revenue loss is obvious: a $450 appointment generates $0 instead of $450. But that missed slot also consumed provider time at $60 to $120 per hour, kept a room occupied and overhead running at $25 to $50 per hour, and left consumables sitting in inventory where they may expire unused. On top of these direct costs, the practice originally spent $100 to $300 in customer acquisition costs to bring that patient in, and if the patient does not reschedule, the full estimated lifetime value of $1,500 to $5,000 is at risk.
The CFO-level formula for total no-show cost brings these together: Total Cost equals Lost Revenue plus Provider Cost multiplied by Time plus Room Cost multiplied by Time plus Customer Acquisition Cost multiplied by the Probability of Patient Loss. Applied to a $450 neurotoxin appointment, the math produces a total cost of approximately $559: $450 in lost revenue, $45 in provider idle time for 45 minutes, $19 in room cost, and $45 in CAC risk at a 30% patient loss probability. The no-show costs more than the appointment was worth.
Most practices underestimate this figure because they only count the direct revenue miss. The idle provider cost, the room overhead, the CAC already spent, and the future visit risk are all real costs that belong in the calculation. When practices start measuring total no-show cost correctly, the urgency of systematic intervention becomes clear immediately.
Why the Financial Impact Gets Underestimated
There are four consistent mistakes practices make when thinking about no-show economics. First, they count only lost appointment revenue and ignore the compounding costs described above. The total cost is typically 110 to 150% of the appointment value, not 100%.
Second, they do not track second-order effects. A patient who no-shows once is three times more likely to no-show again. This increases scheduling uncertainty, forces overbooking that creates rushed appointments, and degrades patient satisfaction for everyone. The ripple cost of a single no-show is higher than the event itself.
Third, they treat all no-shows as equivalent. A first-time patient no-show costs five times more than an established patient no-show because the CAC is unrecovered, and the patient relationship is not yet formed. A high-value service no-show during prime evening hours cannot be filled from a waitlist in two hours. An off-peak consultation often can. These differences matter enormously when designing an intervention strategy.
Fourth, they never calculate the ROI of prevention. Implementing deposits has upfront friction and a small conversion cost. But most practices never model the payback period or measure the show rate improvement by intervention type. Without this measurement, the decision to implement or not implement stays subjective rather than becoming financial.
No-Show Cost Breakdown — $450 Appointment
True total cost vs. face value of appointment — where the money actually goes
Financial Lever 1: Pre-Appointment Deposits
Patients who pay something upfront show up at significantly higher rates than those who pay nothing at booking. The data across healthcare and elective service practices is consistent: a $0 deposit produces a 75% show rate on average, while a $50 deposit produces an 88% show rate, and full prepayment produces a 96% show rate.
| Deposit Amount | Expected Show Rate | Revenue Protected vs. Baseline | Recommended For |
| $0 (No Deposit) | 75% | Baseline | Not Recommended |
| $25 | 82% | +9.3% | Appointments under $200 |
| $50 | 88% | +17.3% | $200–$500 appointments |
| $100 | 92% | +22.7% | Prime-time slots |
| Full Prepayment | 96% | +28.0% | Appointments above $1,000 |
For a practice running 800 appointments per month at an average appointment value of $450 and a current show rate of 75%, the financial impact of implementing a $50 deposit is substantial. The show rate improvement from 75% to 88% reduces no-shows from 200 to 96 per month, recovering 104 appointments. At $450 per appointment, that is $46,800 in recovered revenue monthly, or $561,600 annually. Even accounting for a 2 to 5% conversion rate reduction from the deposit requirement, the net revenue impact is $40,000 to $45,000 per month.
A flat deposit policy is a starting point. A dynamic deposit policy is better. The optimal deposit amount varies by appointment value, patient history, and time slot. Appointments under $200 warrant a 25% deposit to keep the barrier to entry low. Appointments between $200 and $500 warrant a 33% deposit. Appointments above $1,000 warrant 50% or full prepayment. Prime-time slots in the evenings and on weekends, which cannot be filled easily from a waitlist on short notice, warrant higher deposits than off-peak Tuesday morning slots that can be backfilled from a waitlist within hours. Practices using dynamic deposit structures see 22% show rate improvement compared to 15% for flat deposit policies, because the dynamic approach balances conversion and commitment optimally across different appointment types.
Financial Lever 2: Waitlist Economics
A waitlist converts no-shows from pure losses into partial recoveries. The financial model is straightforward: if a practice has 80 monthly no-shows before intervention and can fill 40% of those slots from an active waitlist at an average value of $350, the waitlist recovers $11,200 per month or $134,400 annually against what would otherwise be zero revenue.
The fill rate from a waitlist depends almost entirely on how much advance notice the practice has when a cancellation occurs. With same-day notice of less than four hours, the fill rate is approximately 25%, and the appointments that can be filled tend to be shorter services worth around $280 on average. With 48 hours’ notice, the fill rate climbs to 65%, and the average filled appointment value recovers to $350. With 72 or more hours’ notice, the fill rate reaches 80% at the full average value.
This data has a direct operational implication: the earlier a practice learns about a likely no-show, the more of the revenue can be recovered. Automated reminder systems that require patient confirmation rather than just sending a one-way notification create response data that provides an earlier warning. A patient who fails to confirm at 72 hours should trigger immediate waitlist outreach, not a follow-up reminder at 24 hours. Treating the non-confirmation as a signal rather than an oversight turns the reminder system into an early-warning and revenue-recovery tool.
Waitlist incentive structures that offer a modest discount of 10% for same-day fills preserve profitability while creating additional motivation for waitlisted patients to accept short-notice bookings. An appointment filled at 90% of the standard value is dramatically more profitable than an empty slot.
Financial Lever 3: Cancellation Policy Enforcement
Most practices have a written cancellation policy. Most practices do not enforce it consistently. The data on enforcement consistency is more important than the data on policy severity.
| Policy Type | Show Rate | Patient Satisfaction | Revenue Impact vs. Baseline |
| No Policy | 72% | 95% | Baseline |
| Policy Exists, Never Enforced | 74% | 94% | +2.8% |
| Policy Enforced Inconsistently | 81% | 87% | +12.5% |
| Policy Enforced Consistently | 89% | 85% | +23.6% |
| Automated Cancellation Fee Charged | 92% | 82% | +27.8% |
A policy that exists but is never enforced adds only 2.8% to revenue versus no policy at all because patients learn quickly that the consequences are theoretical. A moderate policy enforced consistently produces 23.6% revenue improvement, more than twice the impact of a strict policy enforced inconsistently. The enforcement gap is where most practices leave $35,000 to $50,000 annually on the table.
The reason enforcement stays inconsistent is emotional friction. Front desk staff feel uncomfortable charging fees to patients they know. Managers make case-by-case exceptions. Over time, the policy becomes a suggestion rather than a standard. The solution is automation: a credit card on file required at booking, fee charging triggered automatically when cancellation criteria are met, and a system policy rather than a staff decision. When enforcement is automated, the emotional friction disappears. The policy applies consistently without anyone having to make an uncomfortable judgment call, and patients experience the policy as standard professional practice rather than a personal imposition.
Financial Lever 4 — Patient Risk Scoring: Three Intervention Tiers
- Low-Risk Patients: No prior no-shows, established relationships, standard booking timeline, standard reminder sequence, no deposit required
- Medium-Risk Patients: First-time patients or appointments booked less than 24 hours in advance, enhanced text + email + phone confirmation sequence plus 25% deposit
- High-Risk Patients: Prior no-show history or multiple reschedules, full prepayment required, day-before confirmation call, automatic waitlist replacement if no confirmation received
- Key Risk Factors: First-time patient adds 25% no-show risk; prior no-show adds 40% per incident; booking under 24 hours adds 30%; multiple reschedules add 20%
- ROI of Targeting: Untargeted interventions produce 10% show rate improvement; risk-appropriate targeting produces 18% same resources, concentrated where they matter most
Implementation Roadmap: 90 Days to Measurable EBITDA Improvement
Month 1 is focused on baseline and infrastructure. Start by calculating the current no-show rate broken down by day of week, time of day, service type, new versus returning patient, and appointment value. This segmentation reveals where the problem is most concentrated and where interventions will have the highest ROI. In parallel, implement a credit card on file requirement, set up an automated reminder sequence that requires patient confirmation rather than just delivering a message, build a waitlist management system, and develop a risk scoring process. End the month with a soft launch, applying new protocols to new patients only while measuring conversion rate impact and collecting feedback.
Month 2 covers full implementation. Extend deposit requirements to all applicable appointments using the dynamic deposit model. Activate automated cancellation fee charging. Monitor the show rate improvement weekly and track the conversion rate impact to confirm the net revenue effect is positive. Identify and address any friction points that are generating patient complaints or meaningful conversion losses.
Month 3 is for optimization. Analyze waitlist fill rates by notice time and refine the incentive structure. Review no-show patterns by risk score and calibrate the intervention thresholds based on actual performance data. Calculate ROI by intervention type to identify which elements are producing the most improvement per dollar of operational cost. Build dashboards that will support ongoing monitoring so the improvement achieved during this 90-day period does not erode over time.
No-Show Reduction Dashboard — What to Track Weekly and Monthly
- Weekly Leading Indicators: Reminder response rate (% of patients confirming), deposit collection rate (% of applicable appointments with deposits on file), active waitlist size, and average risk score trending
- Weekly Performance Metrics: Show rate by day, time, service type, and patient type; total no-show count; waitlist fill rate; and revenue recovered from waitlist fills
- Monthly Financial Metrics: Total lost revenue from no-shows, total recovered revenue from interventions, net improvement versus pre-implementation baseline, and EBITDA impact in absolute dollars
- Monthly Patient Experience Metrics: New patient conversion rate to detect deposit-related friction; patient satisfaction scores; retention rate; and complaint volume related to deposit and cancellation policies
From Operational Nuisance to Financial Strategy
No-shows are one of the largest preventable profit leaks in healthcare and elective service businesses. The practices that recover the most from them are not the ones with the most aggressive policies. They are the ones that have modeled the true financial cost, implemented systematic and risk-appropriate interventions, and measured the results rigorously enough to refine the approach over time.
Moving from reactive, reschedule the patient and move on, to proactive, deposits, risk scoring, waitlist optimization, and automated enforcement, is not operationally complex. The 90-day roadmap described here is achievable for any practice with functioning scheduling software and a willingness to make policy decisions based on financial data rather than gut feeling.
The practices that implement this framework consistently recover $50,000 to $200,000 or more annually in revenue that was previously evaporating. They also create scheduling predictability that improves provider utilization, reduces the operational chaos that overbooking creates, and ultimately improves the experience for patients who do show up. Turning lost appointments into recovered profit is not just good financial management. In a market where margins are tight and patient acquisition costs are rising, it is essential for financial management.
FAQ
1. Will not requiring deposits hurt new patient conversion?
Yes, but less than you think—and the trade-off is worth it.
Typical impact:
– Conversion rate drop: 2–5% – Show rate improvement: 15–20% – Net effect: +10–15% more completed appointments
Mitigation strategies:
– Clear communication of why deposits are required – Emphasize “refundable” and “applied to service” – Make deposit process seamless (integrated with booking) – Offer deposit waiver for established patients
The math:
– 100 leads × 80% conversion × 75% show = 60 patients – 100 leads × 76% conversion × 90% show = 68 patients – Net gain: +13% more revenue
2. What if patients refuse to provide credit card on file?
Offer alternatives: – Full prepayment via other methods (bank transfer, cash) – Higher deposit amount (to offset payment risk) – Limited booking access (off-peak times only)
Reality: 95% of patients provide card when it’s positioned as standard practice, not optional.
3. How do we handle patients who no-show despite deposits?
Financial decision tree:
1. Charge the cancellation fee (automatically) 2. Offer one-time waiver for extenuating circumstances 3. Require full prepayment for future appointments 4. After 2+ no-shows: discharge patient or prepay-only
The key: Make it a policy, not a case-by-case decision.
4. What’s the right cancellation policy timeframe?
Data-driven answer:
| Notice Required | Fill Rate | Patient Satisfaction | Recommended |
|---|---|---|---|
| 24 hours | 45% | High | Too short |
| 48 hours | 65% | Medium-High | Optimal |
| 72 hours | 75% | Medium | Good for high-value |
| 1 week | 85% | Low-Medium | Too strict |
| Best practice: 48-hour notice for most appointments, 72 hours for appointments >$1,000. |
5. How much should cancellation fees be?
Structuring cancellation fees and deposits is conceptually similar to building a pricing strategy grounded in true unit economics and margin.
Financial modeling approach:
“` Optimal Fee = Deposit Amount or 50% of Service Value (whichever is higher) “`
Rationale:
– Too low: Doesn’t change behavior – Too high: Feels punitive, generates complaints – 50% of value: Covers most of opportunity cost
Examples:
– $200 service → $50 deposit, $100 cancellation fee – $500 service → $150 deposit, $250 cancellation fee – $1,000 service → $500 deposit, $500 cancellation fee
6. Should we charge no-show fees differently than late cancellation fees?
For practices with multiple service lines, a rolling profitability model at the procedure or SKU level helps quantify which appointment types justify stricter no-show and cancellation fee structures.
Yes—the costs are different.
| Scenario | Cost to Practice | Recommended Fee |
|---|---|---|
| No-show (no notice) | 100% of opportunity cost | Full deposit forfeited |
| Late cancel (<24 hrs) | 60–80% of opportunity cost | 50% of deposit |
| Late cancel (24–48 hrs) | 30–50% of opportunity cost | 25% of deposit or waived |
| Reason: Graduated fees feel fairer to patients and reflect actual financial impact. |
7. How do we communicate policy changes to existing patients?
Just as you’d segment and test different promotion mechanics when modeling trade spend ROI, you can A/B test policy messaging, fee levels, and grace periods to balance behavior change with patient satisfaction.
Change management strategy:
Phase 1 (Weeks 1–2): Announcement
– Email to all active patients – In-office signage – Social media posts – Emphasize “industry standard” and “respectful of everyone’s time”
Phase 2 (Weeks 3–4): Grace period
– Apply to new appointments only – Remind at booking but don’t enforce fees – Collect feedback and address concerns
Phase 3 (Week 5+): Full enforcement
– Automatic fee charging – Reminder at every booking – Consistent application
Messaging that works:
“To ensure we can provide timely care to all our patients, we’re implementing a 48-hour cancellation policy. This allows us to offer your appointment to another patient from our waitlist and ensures fair access for everyone.”
8. What’s a realistic show rate target?
Benchmarks by practice type:
| Practice Type | Average Show Rate | Best-in-Class | Achievable Target |
|---|---|---|---|
| Medspa | 82% | 95% | 90–92% |
| Dermatology | 85% | 96% | 92–94% |
| Primary Care | 80% | 92% | 88–90% |
| Specialty (Elective) | 78% | 93% | 88–91% |
| Reality check: 100% is impossible. Account for: – Legitimate emergencies (1–2%) – Last-minute illness (2–3%) – Unpredictable life events (1–2%) |
Optimal target: 90–94% show rate for most practices.
—
Conclusion
No-shows represent one of the largest preventable profit leaks in healthcare and service businesses. By treating them as a financial problem—not just an operational inconvenience—and implementing systematic interventions based on data-driven models, most practices can recover $50,000–$200,000+ annually in lost revenue.
The key is moving from reactive (“call them to reschedule”) to proactive (deposits, risk scoring, waitlist optimization). When you model the true financial cost of no-shows and measure the ROI of each intervention, the path to improvement becomes clear and quantifiable.
The practices that master no-show reduction don’t just protect revenue—they create scheduling predictability, improve provider utilization, enhance patient satisfaction (by respecting everyone’s time), and ultimately deliver 3–7 points of additional EBITDA margin.
In an industry where margins are tight and competition is fierce, turning lost appointments into recovered profit isn’t just good operations—it’s essential financial management.
