How to Build a Rolling SKU Profitability Model (A CFO Framework for Managing Product-Level Financial Performance)
SKU-level profitability is the financial truth most consumer packaged goods companies lack. Brands know their total gross margin but rarely know which individual SKUs are producing cash and which are destroying it. A rolling SKU profitability model shows contribution margin, velocity efficiency, channel mix, true net price, trade spend, freight drag, 3PL overhead, spoilage, and inventory carrying cost at the SKU level, updated monthly.
This is one of the most valuable analytics systems in CPG because it drives pricing, promotional decisions, SKU rationalization, production planning, and retailer strategy. Most brands operate with blended P&L reporting that obscures individual product economics, leading to decisions about pricing, promotions, distribution, and product development that are disconnected from which products actually generate cash and which consume it.
Why Gross Margin Lies to You
Consider a granola brand generating $12 million in annual revenue with a reported 38% gross margin. The CEO felt confident. The board felt confident. Then a SKU-level profitability model revealed the uncomfortable truth: three SKUs were generating 62% contribution margin while seven SKUs were operating at a negative 8% contribution after accounting for actual costs.
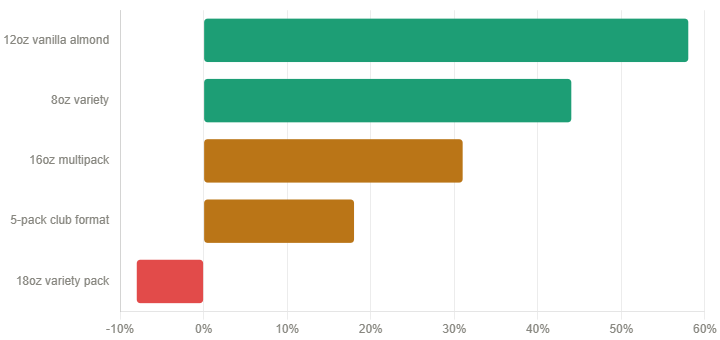
Their best-selling 12-oz vanilla almond SKU was generating 58% contribution margin. Their 18-oz variety pack, designed to win shelf space at a major club retailer, was losing $0.73 per unit after factoring in specialized packaging, additional co-packer handling, higher slotting fees, and the promotional intensity required to move it.
The brand was allocating marketing spend, production capacity, and working capital roughly equally across all SKUs because they only looked at blended gross margin. They were subsidizing losing SKUs with winning ones without realizing it, and they were one retail expansion away from a cash crisis because their growth strategy was centered on scaling the very SKUs that destroyed value.
This is not unusual. Most CPG brands make critical decisions about pricing, promotion, distribution, and product development without understanding which individual products generate cash and which consume it. The SKU profitability model exists to eliminate that blind spot.
What SKU-Level Profitability Actually Measures
A proper SKU profitability model goes far beyond basic gross margin. It tracks every dollar flowing into and out of each SKU across the entire value chain, from cost of goods through fully loaded delivery cost.
Complete SKU Profitability Calculation Structure
| Line Item | What It Captures | Data Source |
| Gross Sales | List price × volume before any deductions | ERP / Order Management |
| Less Trade Spend | Off-invoice deductions, scan-backs, slotting, TPR, and co-op advertising | Trade Spend Management System |
| Less Returns & Damages | Product returned or damaged, credited to retailers | Accounts Receivable |
| Net Sales | Actual dollars received per unit after all trade deductions | Calculated |
| Less COGS | Ingredients, packaging, labor, and production overhead from the co-packer | Co-packer Invoices / ERP |
| Gross Margin | Traditional stopping point for most brands | Calculated |
| Less Freight Inbound | Co-packer to 3PL warehouse movement cost | Freight Invoices |
| Less Freight Outbound | Warehouse to retailer, allocated by actual weight and cube | 3PL / Freight Invoices |
| Less 3PL Fees | Storage, pick/pack, handling specific to each SKU’s characteristics | 3PL Billing |
| Less Spoilage & Obsolescence | Expired, damaged, or disposed of product allocated by SKU | Warehouse / Returns Data |
| Less Inventory Carry Cost | Working capital cost of holding inventory (20–35% annually) | Calculated from Inventory |
| Contribution Margin | The true cash-generating ability of the SKU before corporate overhead | Calculated |
This contribution margin figure represents the actual cash-generating ability of each SKU. It is the number that should drive every strategic decision about pricing, promotion, distribution expansion, and product portfolio management.
Building the True Net Price Foundation
The most common mistake brands make is using list price or invoice price as their revenue figure. The actual net price received per unit differs dramatically from the price on the rate card, and this variance differs by SKU, by channel, and by retailer.
Consider a protein bar brand with three SKUs. Their 50g single bar lists at $2.99 retail, their 5-pack lists at $12.99, and their 10-pack lists at $24.99. They sell to retailers at wholesale prices of $1.79, $7.79, and $14.99, respectively. These look like reasonable margins. But then trade spend enters the equation.
The single bar sells with minimal promotion at the grocery. The 5-pack requires regular temporary price reduction support at $9.99 retail. The 10-pack moves exclusively on promotion at club stores, requiring deep off-invoice funding plus quarterly slotting payments. After accounting for all trade spend, the true net prices become $1.71 for the single bar at a 5% trade rate, $6.42 for the 5-pack at an 18% trade rate, and $11.23 for the 10-pack at a 25% trade rate.
The 10-pack that appeared most attractive from a gross sales perspective now delivers the lowest net price on a per-ounce basis. This matters because COGS and freight costs are driven by weight and cube, not by selling price. A high-volume, high-promotion SKU can easily look strong at the revenue line while destroying value at the contribution margin line.
Building true net price requires connecting data from multiple sources: your trade spend management system capturing all deductions and promotional payments by SKU and retailer, accounts receivable data showing actual cash collected versus invoiced amounts, deduction management records tracking all retailer-initiated deductions with SKU-level detail, and forward trade plans showing committed spend by SKU for future periods.
Many brands discover that their true net price varies 20 to 30 percent between their highest and lowest performing SKUs after accounting for channel mix and promotional intensity. A SKU that is heavily promotional in grocery but sells at an everyday low price in convenience stores has dramatically different economics in each channel, which is why channel-specific profitability analysis is essential rather than optional.
Allocating Freight and Fulfillment Costs by SKU
Most CPG brands treat freight as a blended cost, calculating it as a percentage of sales or allocating it equally across all SKUs. This approach systematically misrepresents the profitability of products with different weight-to-price ratios and different packaging configurations.
A beverage brand allocated freight as 7% of gross sales across its entire portfolio. This worked as a blended average but completely missed the fact that their 12oz glass bottle SKU was incurring 14% freight cost while their 16oz plastic bottle SKU was incurring only 4% due to weight and cube differences. The glass bottle appeared profitable when freight was allocated as a percentage of sales. Once actual freight was allocated by weight and cube, the glass bottle dropped to break-even contribution margin. This insight led to a packaging redesign that maintained premium positioning while reducing weight by 35%, converting the SKU from marginal to highly profitable.
Proper freight allocation requires understanding the actual cost drivers behind each shipment. Weight-based freight covers LTL and parcel shipping costs that scale with actual product weight, including packaging. Cube-based freight covers warehouse space and truckload shipping costs that scale with volume. A product that is light but bulky, like a chip bag, incurs high cube-based costs despite low weight. Handling complexity adds costs for SKUs requiring special handling, temperature control, or fragile item precautions. Order size economics also matter. SKUs shipping in full pallet quantities have different per-unit freight costs than SKUs shipping as case picks in mixed pallets.
Similarly, 3PL fees need allocation by actual SKU characteristics rather than blended rates. Storage fees are allocated by cube and dwell time. Pick and pack fees are allocated by order complexity. Handling fees vary based on case configuration and pallet patterns. A SKU shipping efficiently on standard 40-unit pallets costs less to handle than a SKU requiring custom 28-unit pallets due to weight constraints. Each of these cost differences, applied consistently over tens of thousands of units, creates material differences in true SKU profitability.
Quantifying Spoilage, Damage, and Obsolescence
Perishable and fragile SKUs carry hidden costs that blended P&L reporting obscures. A refrigerated SKU with a 90-day shelf life has fundamentally different economics than a shelf-stable SKU with a two-year shelf life, but most brands never quantify this difference at the individual SKU level.
The model needs to track and allocate several categories of loss:
- Warehouse damage covers product damaged during storage or handling, allocated by actual damage rates observed for each SKU. Glass bottles break more often than plastic
- Expiration and obsolescence cover products that hit code date before selling, which disproportionately affects slow-moving SKUs with short shelf lives
- Retailer returns cover product returned due to damage, code date issues, or slow movement, allocated by actual return rates by SKU and channel club retailers return product aggressively when it does not move
- Promotional waste covers products produced specifically for promotions that get canceled or underperform, leaving excess inventory that may expire or require liquidation below cost
The financial impact of these losses varies dramatically by SKU. A dairy-based beverage brand found spoilage and obsolescence costs ranging from 1.2% of net sales on their fastest-moving SKU to 18% on their slowest-moving refrigerated variety. That 16.8-point differential completely changed the profitability ranking of the portfolio. Quantifying these costs at the SKU level forces hard questions about portfolio rationalization: is it worth maintaining seven varieties when three varieties move fast enough to avoid spoilage, while four consistently lose money to code date issues?
Incorporating Inventory Carrying Cost
Every dollar sitting in inventory is a dollar not earning a return elsewhere in the business. For growth-stage CPG brands operating on tight working capital, this carrying cost represents a real financial burden that belongs in every SKU profitability calculation.
Inventory carrying cost has several components. Cost of capital represents the return you could earn if this cash were deployed elsewhere, typically 10 to 20% annually, depending on your cost of debt or equity and your alternative investment opportunities. Storage costs cover the physical warehouse space occupied by inventory waiting to ship. Insurance and taxes apply because inventory must be insured and, in many states, generates property tax liability. Obsolescence risk increases the longer inventory sits, raising the probability it becomes unsellable due to expiration, damage, or changing market preferences.
Total carrying cost typically ranges from 20 to 35% annually of inventory value. A SKU with four inventory turns per year, meaning average inventory is held for roughly three months, incurs approximately 5 to 9% carrying cost as a percentage of COGS. A SKU with two turns per year, meaning six months average hold, incurs 10 to 18% carrying cost. This differential matters enormously. A slow-turning SKU needs significantly higher gross margin to deliver the same contribution margin as a fast-turning SKU once carrying cost is factored in.
The model calculates carrying cost by measuring average inventory levels for each SKU over the period, multiplying by the annual carrying cost rate, and allocating the result to the SKU’s profitability calculation. This forces visibility into the working capital efficiency of each individual SKU, not just its gross margin in isolation.
Building Channel and Retailer-Specific Profitability
A SKU’s profitability varies dramatically by channel and by retailer within those channels. The same SKU might generate 45% contribution margin in convenience stores, 32% in grocery stores, and 18% in club stores due to differences in trade spend requirements, order sizes, and fulfillment costs. A model that shows only blended profitability misses these differences entirely.
The model should calculate profitability at the SKU-by-channel level at a minimum, and ideally at the SKU-by-retailer level for major accounts. Consider a snack brand with a flagship SKU generating 42% blended contribution margin across all channels. The channel breakdown tells a different story: 51% in convenience with minimal trade spend and premium pricing on small-pack formats, 38% in grocery with moderate trade spend and standard velocity, 24% in club with heavy trade spend and large-pack formats, and 19% in e-commerce with high fulfillment costs, return rates, and advertising spend.
Armed with this breakdown, the strategic implications are clear. Prioritizing convenience and grocery expansion while being selective about club and e-commerce opportunities is a data-driven decision rather than a gut feeling. You might redesign the club offering to improve its economics, or accept that the club serves a strategic brand-building purpose while setting a clear floor on how far its profitability can fall.
Retailer-level profitability analysis within a single channel reveals even more useful nuance. Within grocery, you might find that one major chain delivers 44% contribution margin through premium positioning and low trade requirements, while a regional chain delivers only 22% due to slow velocity, high slotting demands, and frequent markdowns. This level of insight enables genuinely strategic account management. You can negotiate more aggressively with the underperforming account, knowing the relationship is marginally profitable. You can invest more marketing support behind the strong account, knowing it generates superior returns.
Using SKU Profitability to Drive Business Decisions
The model exists to inform action. Here are the specific business decisions where SKU profitability data changes outcomes.
Pricing strategy: SKUs with contribution margins below target thresholds become candidates for price increases. If a SKU is generating 18% contribution when you target 35%, you need a price increase, a cost reduction, or an elimination decision. The profitability model quantifies exactly how much each option would need to improve to reach target economics.
Promotional planning: The model reveals which SKUs can afford promotional support and which cannot. A SKU at 48% contribution margin can sustain 15 to 20 points of incremental trade spend during promotions. A SKU at 22% contribution margin cannot promote without destroying value unless promotional volume lift dramatically exceeds normal rates. Most brands run promotions on both SKU types without distinguishing between them.
Distribution expansion: Before adding distribution at a new retailer, model the profitability impact. If the account requires 22% trade spend and high slotting fees while comparable accounts average 15% trade spend, you need to understand whether the expected velocity will justify the investment.
SKU rationalization: SKUs consistently generating sub-20% contribution margins become candidates for elimination, particularly if they are slow-moving. The working capital tied up in marginal SKUs, the operational complexity of maintaining them, and the management attention they consume often exceed their contribution to the portfolio.
Production planning: Limited co-packer capacity should be allocated to SKUs with the highest contribution margin per production hour. If you can produce one SKU at $4.20 contribution per unit or another at $2.80 contribution per unit in the same production time, the allocation decision has an obvious answer.
New product development: The profitability profiles of your most successful SKUs should inform targets for new products. If your most profitable SKUs share characteristics like specific price points, package sizes, channel focus, or trade spend structures, those patterns should explicitly guide new product design.
Retailer negotiation: Entering retailer negotiations armed with SKU-level profitability data changes the conversation. You can be aggressive on high-margin SKUs where you have room to invest. You can hold firm on marginally profitable items where additional trade requirements would make the relationship unprofitable.
Eliminating Poor Performers
SKU rationalization is one of the highest-return activities available to a CPG finance function, yet most brands do it infrequently and incompletely because the conversations are uncomfortable and the revenue impact is visible, while the cost savings are diffuse.
The financial case for eliminating marginal SKUs is straightforward. Each SKU in the portfolio consumes working capital in the form of inventory. It occupies warehouse space with storage costs. It requires production runs, often in small quantities, that generate high per-unit production costs. It demands trade spend to maintain distribution. It requires sales and marketing management time. It consumes demand planning capacity. When its contribution margin is below the threshold that justifies these costs, the business is paying to maintain a product that reduces rather than increases total profitability.
The typical rationalization analysis ranks all SKUs by contribution margin percentage and by absolute contribution dollars, then identifies those that fall below defined thresholds on both dimensions. A SKU generating 12% contribution margin and $40,000 per year in contribution dollars requires justification to remain in the portfolio. If the justification is strategic, such as a loss-leader that drives velocity of more profitable SKUs or a retailer requirement for listing, that justification should be explicit and documented rather than assumed. If no strong strategic justification exists, elimination is typically the correct decision.
The implementation of rationalization decisions requires careful planning. Retailers need advance notice when a SKU is being discontinued. Existing inventory needs to be sold through or liquidated. Production commitments at the co-packer need to be wound down. Trade spend commitments need to be fulfilled. A well-executed rationalization improves working capital, simplifies operations, and concentrates organizational focus on SKUs with genuine profitability potential.
SKU Rationalization Decision Framework
| Contribution Margin | Annual Contribution | Strategic Value | Decision |
| Above 35% | Any level | Any | Scale — increase marketing and distribution |
| 20–35% | Above $75K | Any | Maintain — monitor for improvement opportunity |
| 20–35% | Below $75K | High | Maintain — strategic exception with documentation |
| Below 20% | Any level | Low | Eliminate or restructure — set 90-day deadline |
| Negative | Any level | Any | Immediate review — cost to maintain exceeds return |
