How to Build a Wholesale Price Increase Model (CPG)
Most CPG brands raise prices reactively because costs went up, margins collapsed, or investors are demanding profitability. But retailers do not accept price increases just because your costs have changed. A wholesale price increase only succeeds when you quantify the financial need precisely, model the retailer-by-retailer impact, anticipate pushback, and time the increase strategically. A proper price increase model evaluates contribution margin gaps, retailer-specific economics, promotional implications, volume risk, and cash flow impact so leadership can negotiate with confidence and avoid costly unforced errors.
Why Most CPG Price Increases Fail
A protein bar brand planned a 12% wholesale price increase across its portfolio. Their ingredient costs had risen 18% over 14 months. Gross margin had compressed from 42% to 34%. The CFO built a straightforward financial model showing that the increase was necessary to restore target margins. The math was sound. The strategy was not.
They announced the increase to retailers with 60 days’ notice. Three major retailers rejected it outright. Two accepted 6% instead of 12%. One accepted the full increase but cut the brand from 8 SKUs to 4. The largest customer accepted the increase but demanded 4 additional promotional weeks and increased co-op advertising funding that effectively returned 7 points of the 12-point increase.
Six months after implementation, revenue had increased 8%, but contribution margin actually declined 3% due to promotional concessions, reduced distribution, and volume declines at retailers who had resisted. The brand would have been better positioned by not attempting the increase and instead focusing on cost reduction and SKU rationalization. This outcome is common. Brands approach price increases as if they are informing retailers of a necessary adjustment. In reality, they are negotiating a complex change to an economic relationship where retailers hold significant leverage and have numerous alternatives.
What a Price Increase Model Actually Does
A CFO-grade price increase model answers seven critical questions before a single retailer is notified. The first question is what the minimum required increase is to achieve financial objectives — not the maximum increase that could be justified, but the minimum necessary given margin and volume requirements. The second question is how each retailer is likely to respond, which varies significantly based on volume importance, category dynamics, competitive alternatives, and relationship history. The third question is what volume decline is acceptable, requiring quantification of the volume elasticity breakeven point. The fourth question is which SKUs should increase and by how much. The fifth question is what the optimal timing is. The sixth question is what retailer-specific concessions might preserve the increase while remaining financially viable. The seventh question is the total P&L and cash flow impact, including volume declines, concessions, implementation timing, and pre-buy distortion.
Quantifying the Contribution Margin Gap
The foundation of any price increase model is understanding the current profitability position and the required profitability position at the SKU level. This requires accurate contribution margin calculation, not just gross margin. Most brands build price increase justification from gross margin. They observe that gross margin was 40% and is now 32%, and conclude they need 8 points back. This logic fails for two reasons. First, it ignores that freight, fulfillment, trade spend, and inventory carrying costs also compress margins independently of product cost. Second, it does not account for dramatically varying profitability across the portfolio.
The correct analysis starts with the contribution margin by SKU. Current contribution margin is calculated as net price after all trade spend, minus cost of goods sold, minus freight, minus third-party logistics fees, minus inventory carrying cost. Required contribution margin is the target needed to cover overhead and generate an acceptable profit. For the protein bar brand, SKU-level analysis revealed dramatic variance. The flagship 2.1 ounce bar had a current contribution margin of 28% against a target of 36%, a gap of 8 points. The 12-pack variety box had a current contribution margin of 19% against a target of 36%, a gap of 17 points. The single-serve 1.2-ounce bar had a current contribution margin of 41% against a target of 36%, meaning it was actually overperforming and carried no financial justification for an increase. This insight produced a differentiated pricing strategy rather than the blanket 12% originally planned.
| SKU | Current Contribution Margin | Target Margin | Gap | Price Increase Decision |
| Flagship 2.1 oz Bar | 28% | 36% | −8 points | 8% increase — high velocity, moderate gap |
| 12-Pack Variety Box | 19% | 36% | −17 points | 14% increase — club-specific, severe gap |
| Single-Serve 1.2 oz Bar | 41% | 36% | +5 points | Hold pricing — already above target |
| Slow-Moving Seasonal Flavors | Various low | 36% | Large negative | Discontinue — not price into profitability |
Modeling Volume Elasticity and the Breakeven Point
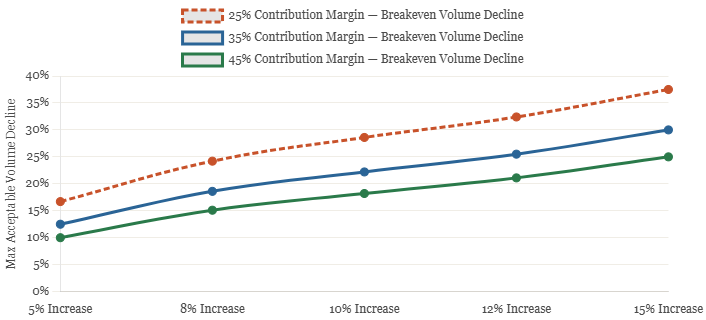
Every price increase causes some volume decline. The central question is whether the margin gain per unit exceeds the profit loss from lower volume. The volume elasticity breakeven formula is straightforward: divide the price increase percentage by the sum of the contribution margin percentage and the price increase percentage. For a brand with 35% contribution margin, considering a 10% price increase, the breakeven volume decline is 10% divided by 45%, which equals 22.2%.
For the protein bar brand, three elasticity scenarios were modeled. In the best case, where competitors follow with their own increases and brand equity is strong, an elasticity of -1.4 was applied. A 12% price increase would cause 16.8% volume decline, well below the 26% breakeven. Total contribution would improve by 8%. In the base case, reflecting mixed competitive response, an elasticity of -1.9 was applied. A 12% increase would cause 22.8% volume decline, slightly above breakeven. Total contribution would be flat to down 2%. In the worst case, where competitors do not follow, the elasticity of- 2.6 was applied. A 12% increase would cause 31.2% volume decline, well above breakeven. Total contribution would decline 12%. This analysis revealed that a 12% increase was high-risk. A more conservative 7 to 8% increase with breakeven at 18 to 20% volume decline offered significantly better risk-adjusted financial returns.
Retailer-Specific Impact Modeling and Timing Strategy
Price increase responses vary dramatically by retailer based on your volume importance to their category, the competitive alternatives they carry, their private label position, and the history of the relationship. For each major retailer, assess your category share at that retailer, retailer category performance, retailer pricing strategy, competitive alternatives they carry, and the relationship history. For the protein bar brand, retailer-specific analysis produced dramatically different projections. At Whole Foods, where the brand held 14% category share and relationships were strong, full acceptance of the proposed increase with minimal volume impact was expected. At Walmart, where the brand held 22% category share but private label was actively growing, acceptance of only 30 to 40% of the increase was projected with significant volume risk.
When a price increase is implemented, the size matters as much as the price increase. Industry pricing patterns provide the most important timing signal. When competitors are raising prices across the category, time to increase to coincide with the broader movement. Retailer line review cycles should drive implementation timing. Announcing increases during active line reviews is a significant strategic error. The protein bar brand identified March as optimal timing: holiday promotions had concluded, the timing was 90 days before summer line reviews, and widely reported ingredient cost increases provided industry-level justification.
| Retailer Request | Financial Cost | Net Impact Assessment | Acceptable? |
| 4 Additional Promotional Weeks | 8 pts trade spend cost | 10 pt increase – 8 pt promo = +2 pts net | Acceptable |
| $25K Co-op Advertising Fund | One-time $25,000 | Acceptable if the annual benefit exceeds $100K at that retailer | Case by case |
| New Fighter SKU Introduction | Cannibalization + supply cost | Model cannibalization impact before agreeing | Requires analysis |
| Net-30 to Net-45 Payment Terms | 15 extra days receivables | Working capital cost often exceeds perception | Avoid if possible |
| 12 pt Promotional Depth on Existing Events | Returns 12 pts of increase | 10 pt increase – 12 pt depth = destroys value | Not Acceptable |
Portfolio Strategy — SKU-Specific Rather Than Blanket Increases
- High-Margin SKUs: Receive no increase or only a modest one highest volume elasticity risk relative to the margin gain available; protecting volume is more valuable than chasing incremental margin
- Low-Margin SKUs with Large Gaps: Warrant aggressive increases if volume declines as a result, the business is losing unprofitable volume, which may not be a meaningful loss
- High-Velocity Anchor SKUs: Balanced moderate approach strategically important to both brand and retailer; preserve velocity while improving economics
- Low-Velocity Poor-Margin SKUs: Evaluate for elimination rather than a price increase — discontinuing simplifies portfolio and concentrates trade spend on better economics
- Premium-Priced SKUs: Conservative treatment widening the price gap further risks share loss; SKUs priced at a discount to competition have more room to increase
Price Increase P&L Impact Simplified vs. Full Model Projections
What the protein bar brand expected vs. what the complete model actually projected revenue, margin, concessions, and net contribution improvement
Common CPG Price Increase Mistakes
- Cost-Based Justification: Retailers respond poorly to supplier cost arguments effective justification focuses on supply continuity, promotional investment sustainability, and category support
- Blanket Portfolio Increases: One-size-fits-all approaches simultaneously over-increase SKUs that don’t need it and under-increase the ones with the largest financial problems
- Ignoring Volume Elasticity: Pressure-testing every increase scenario with realistic elasticity ranges based on category research is not optional; it is the foundation of honest financial modeling
- No Pre-Modeled Concession Limits: Entering negotiations without knowing acceptable tradeoffs produces reactive decisions that frequently give back more than the increase provides
- Insufficient Sales Team Alignment: A sales team that does not genuinely understand the financial necessity will cave immediately to retailer resistance — they must know not just what is being asked but why
Implementation Roadmap and Common Mistakes
Once the model confirms the price increase makes financial sense across realistic scenarios, execution requires careful planning across a 90-day timeline. In the 90 days before implementation, the priority is internal alignment. Sales, marketing, finance, and executive leadership need to agree on the increase rationale, expected outcomes by retailer, and the boundaries of acceptable negotiated concessions. In the 60 days before implementation, a formal written notification goes to retailers with a clear effective date, increase percentage, and a business justification documented. In the 30 days before implementation, active negotiations with retailers incorporate the modeled concession scenarios.
At 90 days post-implementation, a full post-mortem analysis should compare modeled outcomes to actual results across revenue, margin, volume, and concession costs. Learnings about retailer responses, actual volume elasticity by SKU and channel, and negotiation effectiveness should be documented and used to update pricing models before the next increase cycle. The most operationally damaging mistake across all of these is insufficient internal sales team alignment. A sales team that does not genuinely understand the financial necessity of the increase will cave immediately to retailer resistance. Sales must understand not just what is being asked but why, and must be prepared to hold firm on minimum acceptable outcomes before any retailer conversation begins.
FAQ
How often can CPG brands realistically raise prices?
Most CPG brands can implement significant increases every 18-24 months in normal environments, with smaller adjustments annually. Analytics-driven decision-making can help determine optimal pricing strategies, as more frequent increases risk retailer relationships and consumer price sensitivity. During high-inflation periods, annual increases are more acceptable.
What size price increase is typical in CPG?
Most increases range from 5-12%. Below 5% often doesn’t justify the retailer relationship cost and implementation effort. Above 15% faces high rejection risk except during extraordinary cost inflation periods where category-wide increases are occurring.
Should I announce price increases to all retailers simultaneously?
Generally yes, with 60-day formal notice to avoid claims that you’re preferencing some retailers. However, you can sequence discussions strategically, starting with retailers where you expect easy acceptance to build momentum.
What if a major retailer rejects the increase entirely?
Model the options: Accept the rejection and maintain current pricing (losing contribution margin). Hold firm and risk losing distribution (losing volume and presence). Offer a modified smaller increase with concessions (compromising but still improving economics). The model should quantify each path.
How do I handle retailer requests to absorb part of the increase?
Some retailers maintain retail price and ask you to accept a smaller net increase while they preserve their margin. Evaluate whether the reduced increase still closes your contribution margin gap adequately. Sometimes a 6% net increase is better than fighting for 10% and losing distribution.
Should I consider price increases during contract negotiations?
Yes, but separate pricing discussions from distribution and promotional discussions. Don’t let retailers bundle “I’ll accept your price increase if you give me 8 additional promotional weeks” deals that give back more than the increase provides.
What if my price increase causes retailer private label to gain share?
This is a real risk, especially at Walmart, Target, and Kroger. Evaluate whether your brand positioning and differentiation can sustain a price premium over private label. If not, consider cost reduction strategies instead of price increases.
How do I forecast volume impact when my category is growing?
Apply elasticity to your baseline growth trajectory. If you expect 10% category growth and model 15% volume decline from elasticity, your net forecast is -5% volume versus prior year. Don’t make the mistake of assuming category growth insulates you from price-driven volume loss.
Should I implement price increases on promoted volume?
Yes, increase your everyday price and your promoted price proportionally. If you’re at $3.50 everyday/$2.80 promoted and implement 10% increase, move to $3.85 everyday/$3.08 promoted. Maintaining promoted price while increasing everyday price compresses your margin on promotional volume.
What if competitors don’t follow my price increase?
This is the highest-risk scenario. If you increase 10% and competitors hold, you’ll experience elasticity at the high end of your modeled range (possibly -2.5 to -3.0). This is why timing increases with industry-wide cost pressure or competitive pricing moves is critical.
Understanding CPG Costs and Cost Drivers
For CPG companies, achieving sustainable cost savings starts with a clear understanding of the complex web of costs and cost drivers that shape the industry’s economics. The cost base for consumer packaged goods is influenced by a range of key elements—ingredient pricing, labor, packaging, logistics, and marketing investments—all of which can fluctuate rapidly in response to market dynamics and evolving consumer demands. These structural cost drivers are not just line items; they are the levers that determine whether a brand can protect margins, deliver on service levels, and drive top line growth in a fiercely competitive market.
Modern cost reduction programs require a holistic approach that goes beyond traditional cost cutting. CPG leaders must look across the entire value chain, from supply chain operations to commercial levers and consumer behavior, to identify where cost takeout will have the greatest impact. This means leveraging automation, digital tools, and artificial intelligence to optimize business processes, reduce operating costs, and improve efficiency at every stage. Intelligent automation and predictive tools—such as AI-powered analytics and digital twins—enable companies to make informed decisions in real time, targeting cost saving measures that deliver both short term savings and long-term growth.
A smarter approach to cost management involves addressing both fixed costs and variable costs, and understanding how each business function contributes to the overall cost structure. For example, optimizing logistics and inventory management can reduce costs and improve productivity, while strategic pricing and portfolio management can help brands respond to shifting consumer expectations and stay competitive across multiple channels. By analyzing real-time data and consumer behavior, CPG companies can align their cost takeout strategy with strategic priorities, ensuring that cost efficiency does not come at the expense of future growth or market relevance.
Traditional cost programs often fall short because they focus narrowly on immediate cost cutting, missing the bigger picture of structural shifts and evolving consumer demands. To stay ahead, CPG brands must adopt a holistic approach that considers the interplay between operational, functional, and commercial areas. This means investing in new technologies, building an agile operating model, and continuously refining cost reduction efforts based on real-time market feedback.
For CPG leaders looking to drive growth and improve efficiency, the path forward is clear: prioritize cost management, leverage digital transformation, and use AI-powered tools to unlock deeper insights into cost drivers. By doing so, companies can reduce costs, improve their operating model, and position themselves for sustainable success in a rapidly changing market. To dive deeper into CPG cost management and access more resources
