How Fractional CFOs Support Pricing Strategy and Margin Expansion
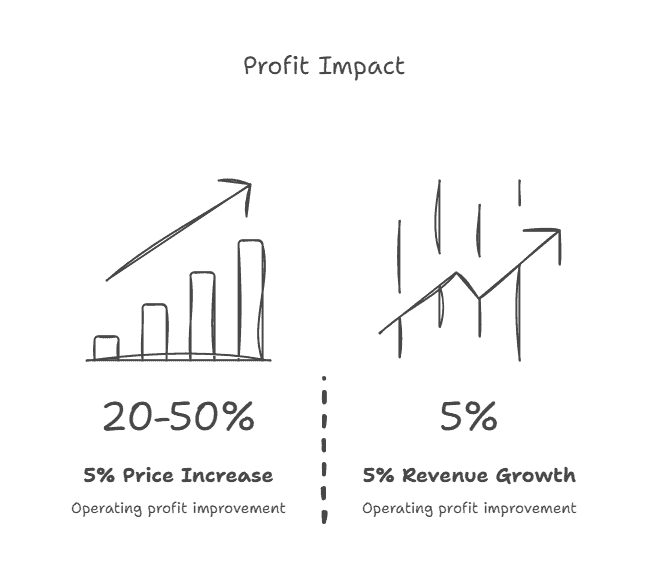
TL;DR: Most companies leave 15-30% of potential profit on the table through underpricing, inconsistent pricing discipline, or failure to capture value delivered. We’ve found that systematic pricing strategy informed by financial analysis delivers 2-3x greater profit impact than equivalent revenue growth initiatives while requiring 10x less capital investment. A 5% price increase typically improves operating profit by 20-50% depending on margin structure—far more than 5% revenue growth through customer acquisition. Effective pricing isn’t about charging more; it’s about capturing fair value for the outcomes you deliver.
The $1.2M Pricing Mistake
Last year, we started working with a B2B SaaS company generating $6M in ARR. They were growing 35% annually with strong product-market fit and excellent customer retention. The founder was preparing for Series A fundraising to fuel continued growth.
During financial analysis, we discovered a troubling pattern. Their pricing hadn’t changed in 3 years despite significant product improvements, expanding feature sets, and growing customer value. They’d launched enterprise capabilities in year two but kept the same pricing tiers. They’d added integrations and automation that customers valued highly but didn’t charge for. They’d implemented customer success programs that demonstrably improved customer outcomes but treated as cost center rather than value driver.
When we analyzed customer interviews and usage data, we found that customers would have paid 20-30% more for the current product without resistance. Many customers told us: “We’d expected to pay much more given the value we’re getting.” Several enterprise customers had budgeted $80K-100K for solutions but were paying only $55K.
We modeled a pricing restructuring: raising prices 15% for new customers, implementing grandfather terms for existing customers, creating premium tiers for enterprise features at 25% premium pricing, and introducing usage-based pricing for high-volume customers. Conservative scenario (15% price realization, 5% customer churn from price sensitivity) showed $780K annual profit improvement. Expected scenario showed $1.1M. Optimistic scenario showed $1.4M.
The company implemented the pricing changes over 4 months. Actual results: 17% average price increase, 2% incremental churn (within normal variance), and $1.27M annualized profit improvement. They achieved 90% of revenue growth goal through pricing alone, requiring no additional customer acquisition spending or operational scaling.
The founder later reflected: “We were planning to raise $3M to fund customer acquisition to reach $10M ARR. The pricing changes meant we could hit $7.5M ARR with current burn rate, requiring only $1.5M raise. That $1.5M in reduced dilution—plus the 35% margin improvement—probably created $4-5M in additional founder value. And we discovered it just by asking ‘are we capturing fair value?'”
This pattern repeats constantly. Companies underprice through inertia, competitor-based pricing without value analysis, fear of customer reaction, or failure to charge for expanded value. They leave millions in profit uncaptured while scrambling to hit growth targets through expensive customer acquisition.
Understanding Pricing’s Profit Leverage
Pricing changes have disproportionate profit impact because they flow directly to the bottom line without increasing costs. Understanding this leverage is crucial for proper prioritization.
The Profit Math of Pricing
Consider a $10M revenue business with 35% gross margin ($3.5M) and 15% operating expenses ($1.5M), generating $2M operating profit (20% operating margin).
A 5% price increase generates $500K additional revenue with no additional cost—all $500K flows to operating profit, increasing it from $2M to $2.5M, a 25% improvement. A 5% revenue increase through customer acquisition generates $500K additional revenue but requires customer acquisition costs (perhaps $125K), delivery costs ($325K at 35% gross margin), and possibly overhead ($75K if scaling operations). Net operating profit improvement is perhaps $150K-200K—10-15% improvement rather than 25%.
The leverage varies by margin structure. For 60% gross margin businesses, pricing has even greater leverage (more gross profit per revenue dollar). For 25% gross margin businesses, pricing still outperforms volume growth but by smaller multiples.
One manufacturing client with 28% gross margins and 12% operating margins discovered that 3% price increase delivered 7x more profit impact than 3% volume increase because volume required proportional COGS while pricing did not. This math informed their strategic shift from volume-focused to value-focused commercial strategy.
The Strategic Value of Margin Expansion
Beyond immediate profit improvement, pricing changes that expand margins create strategic options: more cash flow available for R&D investment, greater flexibility to ride out market downturns, improved valuations in M&A or fundraising scenarios (buyers and investors value margin expansion highly), and capacity to compete on service and quality rather than just price.
Companies with strong margins have strategic resilience companies with thin margins lack. When COVID disrupted markets in 2020, companies with 40% operating margins could sustain 20% revenue decline without crisis. Companies with 10% margins faced existential threat from the same decline.
The Fractional CFO Framework for Pricing Strategy
We’ve developed a systematic approach to pricing optimization that combines financial analysis, customer insights, and competitive intelligence.
Phase 1: Value Quantification
Effective pricing starts with understanding the value you deliver to customers in economic terms, not just product features or customer satisfaction.
Economic Value Analysis: Quantify the financial impact your product or service creates for customers. For productivity software, measure time saved × employee cost × productivity gain. For cost-reduction solutions, measure actual dollar savings from reduced waste, lower vendor costs, or eliminated manual processes. For revenue-enabling tools, measure incremental revenue attributable to your solution × profit margin on that revenue.
One project management software company quantified that their average enterprise customer ($45K annual contract) gained: 200 hours of project manager time saved (worth $20,000), 15% faster project completion (worth $120,000 in earlier revenue recognition), and 8% reduction in project cost overruns (worth $85,000). Total quantified value: $225,000 annually. They were charging $45,000 for $225,000 in value—capturing only 20% of value created.
Willingness-to-Pay Research: Conduct systematic research understanding what customers would pay. This includes Van Westendorp pricing sensitivity analysis (asking customers at what price point the product becomes: too expensive to consider, expensive but worth considering, good value, and suspiciously cheap), conjoint analysis (testing different feature/price combinations), and direct customer interviews about budget allocated for solutions in this category.
We’re often surprised by willingness-to-pay results. Founders assume customers are highly price-sensitive based on anecdotal negotiation conversations, but systematic research reveals most customers would pay 15-30% more without hesitation. The customers pushing hard on pricing during sales are vocal minority, not representative of the base.
Competitive Value Positioning: Understand how your value proposition compares to alternatives. If you deliver 40% more value than competitors but charge the same price, you’re undercharging. If you deliver comparable value but charge 20% premium, you’re overcharging unless differentiated on other dimensions (support, brand, ease of use).
This analysis often reveals that companies are competing on price unnecessarily. One cybersecurity vendor discovered their solution prevented breaches that competitors’ solutions missed, worth $500K-2M in avoided breach costs. Yet they were priced comparably to inferior solutions because they’d never quantified the differential value.
Phase 2: Pricing Architecture Design
Once you understand value delivered, design pricing structure that captures it effectively.
Pricing Model Selection: Choose from subscription (monthly/annual recurring), usage-based (pay per transaction/user/seat), value-based (percentage of value created), tiered (good/better/best packages), or freemium (free base + paid premium). The right model depends on your value drivers and customer preferences.
SaaS companies with consistent value per user benefit from per-seat pricing. Companies where value scales with usage benefit from consumption pricing. Companies where value varies dramatically by customer benefit from value-based pricing or custom enterprise pricing.
Tier Structure: For tiered pricing, establish tiers that: capture different willingness-to-pay segments (SMB, mid-market, enterprise), create clear upgrade paths as customers grow, concentrate 60-70% of customers in middle tier (avoiding concentration in low tier), and price premium tier at 2-3x base tier (ensuring meaningful revenue from high-value customers).
Common mistake is creating too many tiers (5+ tiers creates decision paralysis) or poorly differentiated tiers (why would I pay 40% more for 15% more features?). Three tiers is typically optimal: base tier with core functionality, professional tier with expanded features for primary market, and enterprise tier with advanced capabilities for large customers.
Anchoring and Reference Pricing: Pricing perception matters as much as absolute price. Strategic use of anchoring (displaying higher-priced options first to make mid-tier seem reasonable) and reference pricing (showing value delivered or alternative costs) influences purchasing decisions.
One professional services firm restructured proposal presentation to show: project cost ($85,000), alternatives (internal team: $140,000; competitor A: $95,000), and ROI (expected first-year return: $280,000). This framing positioned their $85,000 price as bargain relative to alternatives and modest relative to returns, increasing win rate from 34% to 47% without changing actual pricing.
Phase 3: Implementation Strategy
Pricing changes require careful implementation to minimize customer disruption and negative reaction.
Grandfather vs. Sunset Approaches: Existing customers can be: grandfathered at current pricing indefinitely (maintains revenue but doesn’t capture value), migrated to new pricing at renewal (may trigger churn but captures value), given grace period (12-18 months at current pricing, then migrate), or offered upgrade incentives (enhanced features/services for accepting new pricing).
The right approach depends on customer contract terms, competitive dynamics, and retention risk. We generally recommend grandfather for top 20% of customers (by revenue or strategic value) while migrating others at renewal.
Communication Strategy: Price changes require clear, confident communication emphasizing value delivered, product improvements since last pricing, and competitive positioning relative to alternatives. Weak communication (“we’re forced to raise prices due to costs”) invites pushback. Strong communication (“we’re aligning pricing with expanded value we deliver”) frames change positively.
Include specific examples of value delivered: “Since launching 18 months ago, we’ve added 12 major features including X, Y, Z that customers tell us save 15+ hours monthly. We’ve expanded support from email-only to 24/7 phone support. We’ve improved uptime from 99.5% to 99.95%. These improvements have increased our costs but more importantly have increased value delivered to you.”
Pilot Testing: For major pricing changes, pilot test with subset of customers or new customers only before broad rollout. This validates assumptions about price sensitivity and conversion impact without betting the entire business on untested pricing.
One SaaS company tested 20% price increase with new customers for 90 days. Conversion rate declined from 12% to 11.2%—within normal variance and far less than feared 15-20% decline. Customer feedback revealed price wasn’t primary objection; onboarding complexity was. They implemented the price increase broadly while also addressing onboarding, achieving better outcomes than price increase alone.
Phase 4: Pricing Discipline and Governance
Pricing strategy succeeds only if consistently executed. This requires governance preventing ad-hoc discounting and inconsistent pricing.
Discount Approval Matrix: Establish clear rules for discounting: sales reps can offer up to 10% discount without approval, 10-20% discount requires sales manager approval, 20-30% requires VP Sales approval, 30%+ requires CFO/CEO approval. Every discount over 5% requires documented business justification.
We’ve found that simply requiring justification reduces discounting by 15-25% because salespeople can’t be bothered with paperwork for marginal deals. This “friction-based” discipline proves surprisingly effective.
Win/Loss Analysis by Price Point: Track win rates and revenue by price tier to understand pricing effectiveness. If win rate at list price is 45% but win rate with 20% discount is 48%, you’re training customers to negotiate. If win rate at list price is 25% but 48% with 15% discount, your list price may be too high.
One company discovered their enterprise tier (positioned at 3x mid-tier pricing) had 12% win rate while mid-tier had 42% win rate. Rather than concluding enterprise pricing was too high, analysis revealed enterprise features weren’t differentiated enough. They enhanced enterprise tier with dedicated success manager and advanced analytics, enabling 28% enterprise win rate at same pricing.
Regular Pricing Reviews: Conduct formal pricing review quarterly or semi-annually asking: has our cost structure changed requiring pricing adjustment? have we added features or value requiring price increase? has competitive landscape shifted requiring repositioning? are we hitting target win rates and margin goals?
Companies treating pricing as “set it and forget it” slowly drift to margin erosion as costs increase and value expands without corresponding price adjustments.
Common Pricing Mistakes That Destroy Margin
Through hundreds of pricing engagements, we’ve identified errors that repeatedly cost companies millions in foregone profit.
Cost-Plus Pricing: Many companies price by calculating costs and adding target margin (e.g., “this costs us $50 to deliver, we want 40% margin, so we charge $70”). This ignores value delivered and leaves money on table when value exceeds cost by wide margins. Cost-plus might be appropriate for commodity products but is value-destructive for differentiated solutions.
One software company priced based on development costs plus margin. A feature that cost $80K to build and served 1,000 customers was priced to recover $200K over 3 years ($20/user/year). But the feature saved customers $500/year each—massive underpricing relative to value. Switching to value-based pricing enabled 4x price increase with minimal customer sensitivity.
Competitor-Based Pricing: Pricing to match competitors assumes you deliver equal value and target identical customers—rarely true. If you deliver superior value, competitor matching leaves profit uncaptured. If you deliver less value, competitor matching creates sales challenges.
Better approach is understand your differentiation and price accordingly. If you deliver 30% more value than competitors, charging 15% premium is justified. If competitors are targeting enterprise and you’re targeting SMB, their pricing is irrelevant to your market.
Feature-Parity Pricing: Companies sometimes offer 90% of competitor features at 70% of competitor price, hoping to compete on value. This positions you as discount provider and attracts price-sensitive customers who’ll leave for cheaper alternatives. It also suggests your product is inferior (why else would you charge less?).
If you can’t charge premium pricing, question whether you have genuine differentiation. If you do have differentiation, charge premium and focus messaging on your unique value rather than competing on price.
The “Strategic” Deal Trap: Sales teams justify heavy discounting as “strategic”—the customer is a valuable reference, could expand significantly, or provides market entry. While occasionally legitimate, most “strategic” deals aren’t remotely strategic—they’re deeply discounted deals with customers who’ll never pay full price and will churn at renewal when discount expires.
Establish clear criteria for genuinely strategic deals: valuable logo that enables closing 5+ additional customers (documented), initial small deal ($20K) with high-probability expansion to $200K+ within 18 months (based on customer budget and needs assessment), market entry where landing first customer enables competitive differentiation in new segment. If the deal doesn’t meet these stringent criteria, it’s not strategic—it’s just cheap.
Margin Expansion Beyond Pricing
While pricing is highest-leverage margin improvement, other strategies compound the impact.
Product Mix Optimization: Within multi-product portfolios, some products have 60% margins while others have 25% margins. Shifting sales focus to higher-margin products improves overall margin without changing any individual product’s price. Sales compensation structures that reward gross profit dollars (not just revenue dollars) naturally incentivize this shift.
Service Attach Strategy: For product businesses, attaching services (installation, training, support) improves margins because service margins often exceed product margins. One hardware company with 32% product margins offered implementation services at 58% margins. Increasing implementation attach rate from 40% to 65% of sales improved blended margins by 6 percentage points.
Operational Efficiency: Margin expansion also comes from reducing delivery costs while maintaining pricing. Automation, outsourcing, process improvement, or vendor negotiations that reduce COGS flow directly to margin improvement. A 5% reduction in COGS creates similar impact to 5% price increase (though price increase is often easier to implement).
Customer Segmentation and Pruning: Not all customers are equally profitable. Segmenting by profitability (accounting for acquisition costs, service costs, payment terms, and churn risk) often reveals that 15-25% of customers are value-destructive. Pruning these customers—through price increases they won’t accept, reducing service levels, or active termination—improves overall profitability.
One professional services firm analyzed customer-level profitability and discovered their smallest clients (under $50K annual fees) were unprofitable after accounting for relationship management time and customization demands. They implemented $60K minimum with exception-approval-only policy. Over 18 months, they lost 22 small customers (8% of customer count) representing 3% of revenue but improved EBITDA margin from 14% to 19% by eliminating low-margin work.
The Role of Fractional CFO in Pricing Strategy
Fractional CFOs contribute specific capabilities that make pricing strategy more effective:
Financial Modeling: CFOs build sophisticated models showing profit impact under different pricing scenarios, enabling data-driven decisions rather than gut-feel pricing. These models account for price sensitivity, customer mix shifts, and operational impacts.
Value Quantification: CFOs translate operational improvements and product features into economic value for customers, enabling value-based pricing discussions rather than cost-based or competitive pricing.
Margin Analysis: Detailed margin analysis by customer, product, and channel reveals where profit is being created or destroyed, informing pricing strategy and customer focus.
Deal Approval Discipline: CFOs establish and enforce discount approval processes, preventing margin erosion through ad-hoc sales discounting.
Pricing Communication: CFOs develop financially-grounded messaging for pricing changes, helping sales and customer success teams explain value delivered and justify pricing.
Board and Investor Relations: CFOs communicate pricing strategy and margin expansion plans to boards and investors, demonstrating financial sophistication and value-creation focus.
—
FAQ
How do we implement price increases without losing customers or damaging relationships?
Fear of customer loss prevents many companies from necessary pricing adjustments, but research consistently shows that well-communicated, value-justified price increases typically generate far less churn than anticipated. We’ve found that 5-8% price increases (implemented with proper communication) generate only 1-3% incremental churn—far less than the revenue and profit improvement from pricing. Several principles minimize churn risk. First, communicate value explicitly. Don’t just announce “we’re raising prices 12%.” Instead: “Over the past 18 months, we’ve added features X, Y, Z that our customers tell us save 15+ hours weekly. We’ve expanded support from email-only to 24/7 phone. We’ve maintained 99.97% uptime. These improvements have increased our costs but more importantly have dramatically increased value delivered. To ensure we can continue investing in the product and support you value, we’re adjusting pricing to align with value delivered.” This frames the increase as value-based rather than arbitrary. Second, grandfather your best customers. Identify top 15-20% of customers by revenue, relationship strength, or strategic value, and offer them extended grandfather periods (12-24 months at current pricing) or permanent pricing protection. This protects key relationships while still capturing value from the broader base. Third, provide advance notice (60-120 days) enabling customers to budget appropriately and ask questions. Surprise price increases at renewal generate frustration; well-communicated advance notice is generally accepted. Fourth, offer value-adds for customers accepting price increases. Perhaps enhanced support, additional user seats, or premium features. This gives customers tangible benefit alongside pricing adjustment. Fifth, time increases strategically—implement at renewal for subscription businesses, not mid-contract. For project-based businesses, adjust pricing for new projects while honoring existing project terms. Sixth, be willing to lose a few customers. If 3% of customers churn over 12% price increase that improves revenue by 9% after churn, you’ve created substantial value. The goal isn’t zero churn; it’s optimizing the profit trade-off. One SaaS company implemented 15% price increase and offered existing customers: accept new pricing and receive 2 additional user seats plus priority support, or maintain current pricing for 18 months then migrate to new pricing. 78% of customers immediately accepted the new pricing for the value-adds. Another 15% took the 18-month extension. Only 7% churned over price—less than annual churn baseline. The company captured $920K in annualized profit improvement while actually improving customer satisfaction through the value-adds.
How do we establish initial pricing for a new product or service where no clear reference points exist?
Pricing new-to-market offerings is challenging because customers lack reference points and competitive benchmarking doesn’t exist. We use several approaches to establish rational pricing. First, value-based floor pricing—calculate the minimum economic value you create for customers. If your product saves customers 10 hours weekly at $50/hour blended rate, that’s $26,000 annual value created. Capturing 15-30% of value created suggests $4,000-8,000 annual pricing floor. Below this, you’re dramatically underpricing relative to value. Second, willingness-to-pay research with early prospects—conduct structured interviews asking about budget allocated for solving this problem, what they’d expect to pay for the described solution, and price points that seem too expensive, reasonable, or surprisingly cheap. Van Westendorp analysis from 30-40 interviews provides reasonable pricing range even without existing market. Third, analogous market pricing—while direct competitors don’t exist, analogous solutions might. If you’re building AI-powered analytics, examine pricing for traditional analytics tools ($300-1,500 monthly) and consulting alternatives ($20,000-50,000 projects). Your pricing should fit somewhere within the range of alternatives you’re displacing. Fourth, cost-plus with healthy margin as absolute floor—calculate your fully-loaded cost to deliver (development amortization, hosting, support, overhead) and multiply by 5-10x for software or 2-3x for services. This ensures profitability while recognizing that software/service pricing should bear limited relationship to costs. Fifth, experiment with tiered pricing to capture different willingness-to-pay segments. Rather than betting everything on single price point, offer three tiers ($99, $299, $799 monthly) and see where demand concentrates. This market feedback informs pricing evolution. Sixth, plan for pricing increases as value is proven. Many successful companies intentionally underprice at launch ($50/month) to accelerate adoption and customer development, then raise prices ($150/month) once value is demonstrated and customers are dependent. Early adopters get rewarded for taking risk; later customers pay for proven value. The key mistake is anchoring too low out of fear—it’s far easier to decrease pricing if you overshoot than increase pricing after establishing market expectations. One fintech company launching novel product considered pricing at $25/month to encourage adoption. Value analysis showed they saved customers $200+ monthly. We recommended launching at $99/month with promotional pricing of $49/month for first 6 months. This established value-aligned pricing while offering compelling early adopter deal. After 6 months, they had 1,200 customers at $49/month, raised pricing to $99 for new customers (losing only 8% of conversion rate), and offered existing customers $79/month to upgrade to expanded feature set. Within 12 months, they had $95 blended ARPU with clear path to $120+ as grandfather periods expired—far better than if they’d anchored at $25.
How do we balance pricing optimization with maintaining competitive win rates and not becoming too expensive for our target market?
This tension between margin optimization and market share growth is real, but it’s often false choice created by assuming price is primary purchase driver when research consistently shows it’s one of many factors. We manage this through data-driven optimization rather than fear-based assumptions. First, measure actual win rate sensitivity to pricing. Track win rates across your pricing tiers and by discount levels. If your win rate at list price is 38% while win rate at 15% discount is 42%, you’re leaving 4 percentage points of win rate on the table by maintaining higher pricing—but that might be financially optimal trade-off. Calculate: is the 4-point win rate improvement worth 15% revenue haircut on every deal? Usually not. Second, understand competitive losses—when you lose deals, rigorously track whether price was actual issue or convenient excuse. Sales teams often blame price when real issues were feature gaps, trust deficits, or poor sales execution. Requiring structured win/loss analysis often reveals that 60-70% of losses attributed to “price” had other root causes. Third, test pricing experimentally. Rather than guessing whether 15% price increase will destroy win rates, test it with subset of opportunities over 60-90 days. One company feared 10% price increase would decimate win rates. Test showed win rate declining from 31% to 29%—statistically insignificant while dramatically improving margins. Fourth, compete on value, not price. If you’re losing deals to lower-priced competitors, investing in better value communication and differentiation usually outperforms price cuts. Sales training, case studies, ROI calculators, and customer testimonials improve win rates without eroding margins. Fifth, segment pricing by customer value. Instead of single pricing that’s too high for SMB and too low for enterprise, implement tiered pricing capturing different segments. Base tier at $299/month wins SMB deals; enterprise tier at $1,999/month captures large customer value. This “Good, Better, Best” approach maximizes both market coverage and margin. Sixth, recognize that modest win rate decline from higher pricing is often financially optimal. If 10% price increase reduces win rate from 35% to 31% but improves revenue per win by 10%, you’ve improved revenue per opportunity from 0.35 × $100 = $35 to 0.31 × $110 = $34.10, roughly neutral on revenue but dramatically better on profit since the 10% price increase flows straight to margin. Finally, track Customer Lifetime Value (LTV) not just win rates. Winning lots of highly price-sensitive customers who churn quickly and never expand produces worse outcomes than winning fewer customers who stay longer and expand. One services company maintained aggressive pricing achieving 52% win rate but faced 45% annual customer churn. Competitor had 38% win rate with 15% annual churn and 130% net revenue retention. The competitor’s lower win rate produced better unit economics and faster growth through expansion. Win rate is vanity metric; LTV and profitability are reality.
