Financial Due Diligence Preparation: The 90-Day Roadmap to Exit Readiness
In our CFO practice, we’ve guided dozens of businesses through successful exits and acquisitions. The difference between companies that command premium valuations and those that leave millions on the table rarely comes down to revenue or profitability—it comes down to financial preparedness. When a buyer’s due diligence team arrives, they’re not just verifying numbers. They’re looking for red flags that justify price reductions or deal termination.
The painful reality: most business owners don’t start preparing their financials for due diligence until they have a buyer interested. By then, it’s too late to fix the structural issues that destroy valuations. We’ve seen owners watch their expected $15M exit shrink to $11M because their revenue recognition policies were inconsistent, their customer concentration was poorly documented, or their financial systems couldn’t produce auditable reports.
Exit readiness isn’t something you achieve in the final months before sale. It’s a state of continuous operational excellence that makes your business attractive to buyers while making it easier to run profitably today. The companies that command premium multiples maintain what we call “perpetual due diligence readiness”—their financials can withstand scrutiny at any moment.
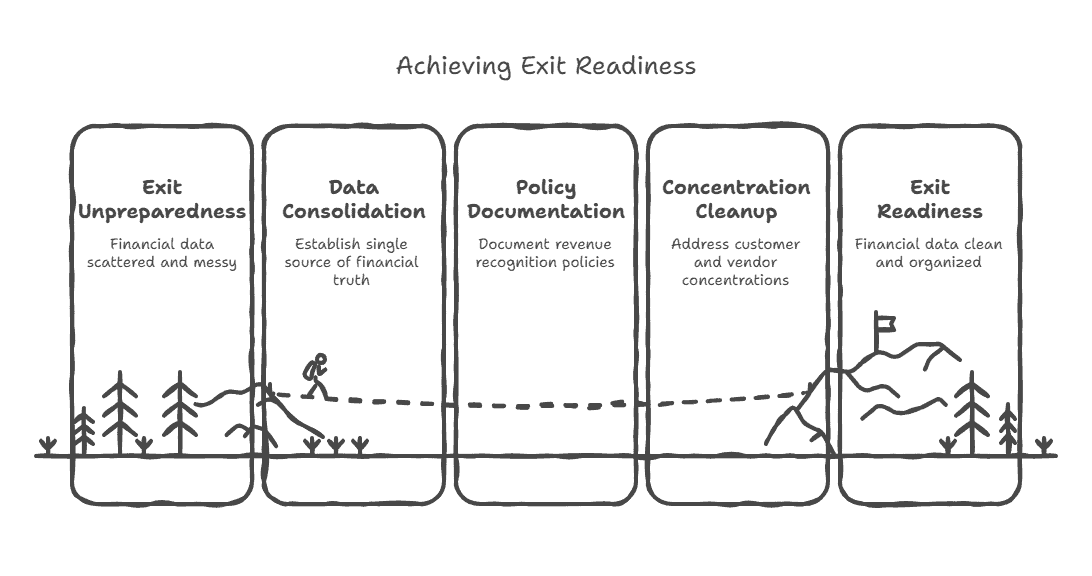
TL;DR: Financial due diligence preparation determines whether your exit succeeds or fails. This 90-day roadmap addresses the critical areas buyers scrutinize: establishing a single source of truth for financial data, documenting revenue recognition policies, cleaning up customer and vendor concentrations, reconciling multi-year financial statements, and building the reporting infrastructure that proves your business runs on systems rather than founder heroics. Companies that maintain continuous due diligence readiness command premium valuations and close faster with fewer price reductions. To assess where your company currently stands, take the free IPO Readiness Assessment.
The Due Diligence Reality Check
Due diligence is where deal values get destroyed. A software company we worked with had $8M in revenue with 40% EBITDA margins—exceptional metrics that should have commanded a 6x multiple. During due diligence, the buyer discovered that 35% of revenue came from three customers, none of whom had contracts extending beyond 12 months. The final multiple: 3.8x. That customer concentration issue cost the owners $9.6 million.
Another client, a distribution business doing $22M annually, faced a different nightmare. Their bookkeeping was clean, their P&L looked solid, but they couldn’t produce a comprehensive customer list with accurate purchase history. Their QuickBooks data had been migrated twice, creating duplicate customer records and fragmented transaction histories. The buyer’s diligence team spent three weeks trying to reconstruct customer analytics. Frustrated by the delays and concerned about data integrity, they reduced their offer by $1.8M and added earnout provisions that shifted risk to the sellers.
These aren’t edge cases. They’re the norm for businesses that treat financial operations as necessary overhead rather than strategic infrastructure. The companies that maximize exit value share a common characteristic: their financial systems produce trustworthy data that buyers can verify quickly and confidently.
The 90-Day Due Diligence Preparation Roadmap
Month 1: Establish Your Single Source of Truth
Due diligence begins with a fundamental question: where does accurate financial data live? If your answer involves multiple spreadsheets, various software systems, or requires extensive reconciliation, you have a problem.
Week 1-2: Financial System Audit and Reconciliation
Start by documenting every system that contains financial data: accounting software, CRM, inventory management, payroll, banking platforms. Map the data flows between these systems. Where do discrepancies occur? A manufacturing client discovered their inventory system showed $340,000 more inventory value than their accounting system—a discrepancy that had existed for 18 months because the systems didn’t reconcile automatically.
Create a comprehensive reconciliation between all systems and your general ledger. Every balance sheet account should tie to a supporting schedule. Every revenue number should trace to underlying transaction data. This process typically uncovers issues that need immediate correction.
Week 3-4: Chart of Accounts Restructuring
Your chart of accounts should tell a strategic story, not just satisfy compliance requirements. Buyers want to understand revenue by product line, customer segment, and geography. They want to see cost of goods sold broken down by major component. They need operating expenses categorized in ways that reveal operational leverage.
We rebuilt a service company’s chart of accounts to separately track revenue from their three service lines (previously lumped together as “service revenue”). This simple change revealed that their highest-margin service line was growing 40% annually while their lowest-margin line was declining. That insight increased the company’s valuation by highlighting growth potential in their most profitable segment.
Month 2: Document Revenue Recognition and Customer Economics
Week 5-6: Revenue Recognition Policy Documentation
Create a written revenue recognition policy that explains exactly how your company recognizes revenue for every product and service type. This seems basic, but many companies operate on informal policies that live in the controller’s head.
For subscription businesses: document how you handle setup fees, annual prepayments, multi-year contracts, and contract modifications. For project-based businesses: explain your percentage-of-completion methodology or milestone-based recognition. For product businesses: detail your shipping terms, return policies, and warranty reserve calculations.
A SaaS client had recognized revenue inconsistently—sometimes on booking, sometimes on cash receipt, sometimes on delivery. We documented a clean policy (recognize monthly over contract term) and retroactively adjusted three years of financials to apply it consistently. The restatement reduced reported revenue by 8% in year one but increased it by 12% in year three, demonstrating accelerating growth that buyers value highly.
Week 7-8: Customer Concentration and Cohort Analysis
Buyers obsess over customer concentration because it represents risk. Document your top 20 customers with their contract terms, purchase history, pricing agreements, and relationship strength. If any customer represents more than 10% of revenue, prepare detailed documentation on contract duration, renewal history, and relationship resilience.
Build cohort analysis showing customer retention by acquisition year. A company that retains 90% of customers year-over-year is worth substantially more than one with 70% retention, even at identical revenue levels. We helped a B2B services company build cohort analysis revealing 94% retention among customers who stayed beyond year one (despite 40% churn in year one). This insight allowed them to position their business as having highly predictable recurring revenue once customers completed onboarding.
Month 3: Build Reporting Infrastructure and Future Projections
Week 9-10: Management Reporting Package Development
Create a standardized monthly reporting package that includes: P&L with prior year comparison and budget variance, balance sheet with supporting schedules, cash flow statement, and key operational metrics. This package should be producible within 10 business days of month-end without heroic effort.
The test: can someone other than your controller produce these reports? If not, you have a process documentation problem. Buyers worry that financial operations depend on specific individuals rather than documented systems.
We implemented this with a professional services firm that previously required their CFO to spend 40 hours each month manually compiling reports from various sources. We systematized the process through automated data connections and standardized templates. Report production time dropped to 6 hours, and importantly, two other team members could now produce identical reports.
Week 11-12: Financial Projections and Assumptions Documentation
Build a bottoms-up financial model projecting 3 years forward. This should be driver-based (unit economics, headcount, capacity constraints) rather than simple percentage growth assumptions. Document every assumption: why are you projecting 25% revenue growth? What headcount additions enable it? What’s the impact on working capital?
A distribution company we worked with projected 35% revenue growth based on expanding to two new regions. We helped them build a detailed model showing required warehouse space, headcount by role, inventory investment, and customer acquisition costs for each region. When buyers saw this level of planning rigor, they viewed the projections as credible rather than aspirational, supporting a higher valuation multiple.
The Continuous Maintenance Approach
The 90-day roadmap gets you to due diligence readiness, but maintaining it requires ongoing discipline. We recommend quarterly “mini due diligence” reviews where you stress-test your financial infrastructure:
– Can you produce a complete data room in 48 hours?
– Are all reconciliations current with no unexplained variances over $5,000?
– Do your revenue recognition policies still match actual practice?
– Have customer concentration metrics improved or deteriorated?
– Can your financial systems produce all reports buyers typically request?
Companies that maintain this discipline find that due diligence becomes straightforward. One client who implemented continuous readiness received an unsolicited acquisition offer and moved from NDA to signed LOI in 23 days—compared to the typical 60-90 days—because their financial documentation was immediately available and clearly organized.
The Valuation Impact of Financial Readiness
Beyond faster deal timelines, financial preparedness directly impacts valuation in three ways:
Risk Reduction Premium: Buyers pay more for businesses where financial data is trustworthy and systems are documented. The reduction in perceived risk translates to higher multiples. We’ve seen prepared companies command 0.5-1.0x higher multiples than comparable but less organized competitors.
Earnout Avoidance: When buyers can’t verify financial performance, they shift risk through earnouts—future payments contingent on hitting targets. Earnouts usually fail (fewer than 30% pay out fully) and create conflicts between buyers and sellers. Strong financial documentation allows sellers to capture more value upfront rather than gambling on earnouts.
Competitive Tension: When you can move quickly through due diligence, you can run competitive processes where multiple buyers bid simultaneously. This competition drives prices up. Conversely, if due diligence drags on for months, buyers lose enthusiasm and negotiate harder.
Frequently Asked Questions
Should I hire a Big Four firm to audit my financials before selling?
Not necessarily. For businesses under $20M in revenue, audited financials rarely justify their cost ($40,000-$100,000 annually) unless you’re in a highly regulated industry or targeting strategic buyers who require audits. Instead, focus on having reviewed financials (much less expensive) and bulletproof reconciliation between all your financial systems. Buyers care more about data integrity and system documentation than audit opinions for smaller middle-market transactions. Above $50M in revenue, audited financials become more standard and may be worth the investment 2-3 years before a planned exit.
How do I address customer concentration if I can’t reduce it before selling?
Document relationship strength, contract terms, and dependency factors. If a major customer represents 30% of revenue, show that they’ve been with you for 8 years, they’ve increased spending every year, you have a contract through 2027, and you’ve expanded from serving one division to supporting five. Provide reference letters from key stakeholders. Get customers to participate in buyer calls confirming relationship strength. You can’t eliminate concentration overnight, but you can mitigate buyer concerns through comprehensive documentation. We’ve also seen sellers obtain customer contracts with extended terms or minimum purchase commitments as they prepare for sale—this reduces perceived risk significantly.
What if our financials show declining revenue or margins in recent quarters?
Address it directly with explanation and correction plans. Buyers discount companies with negative trends, but they discount them even more severely when sellers try to hide or minimize the issues. If revenue declined 12% year-over-year, explain exactly why (lost major customer, deliberate shedding of low-margin work, industry contraction) and demonstrate how you’ve responded (new customer wins, margin improvement initiatives, market repositioning). Include this narrative in your CIM and data room rather than waiting for buyers to discover and question it during diligence. Companies that transparently address weaknesses while showing correction plans maintain buyer confidence far better than those that defensively explain away every negative trend.
