How to Improve Working Capital in CPG: A CFO Framework for Liquidity, Growth, and Margin Expansion
Working capital is the strongest predictor of survival for CPG companies between $5M and $75M in revenue. Yet most brands focus on revenue growth while ignoring the cash trapped in inventory, receivables, deductions, and inefficient production cycles. COGS optimization is a key lever for strategic cost management and operational efficiency in CPG companies, helping drive sustainable growth and resilience. A CFO-grade working capital playbook evaluates the full cash conversion cycle, models inventory flows, restructures payment and collection terms, eliminates deduction lag, and right-sizes production batches. When executed properly, CPG companies can unlock 15 to 45 days of liquidity and improve cash runway without raising new capital.
Why Working Capital Kills Growing CPG Companies
We worked with a beverage brand growing 48% year-over-year. Revenue hit $22M. Gross margin was strong at 41%. The P&L looked beautiful. The bank account was empty. They had $47K in cash against $380K in payables due within 14 days. They were two weeks from insolvency despite profitable growth.
The problem was working capital. Every dollar of revenue growth required $1.38 of working capital investment. Inventory had grown from $680K to $1.9M as they expanded distribution. Receivables ballooned from $920K to $2.6M as major retailers took 75 days to pay instead of the contracted 45 days. Deductions lagged 90+ days behind shipments, creating a $340K gap between booked revenue and collected cash.
They were trying to fund 48% growth with 12% EBITDA margins. The math was unsustainable. Growth consumed cash faster than operations generated it. They were literally growing themselves into bankruptcy. Implementing strategic cost reductions and maintaining profitability are critical to avoid financial distress during periods of rapid growth, ensuring the business can sustain operations and weather cash constraints.
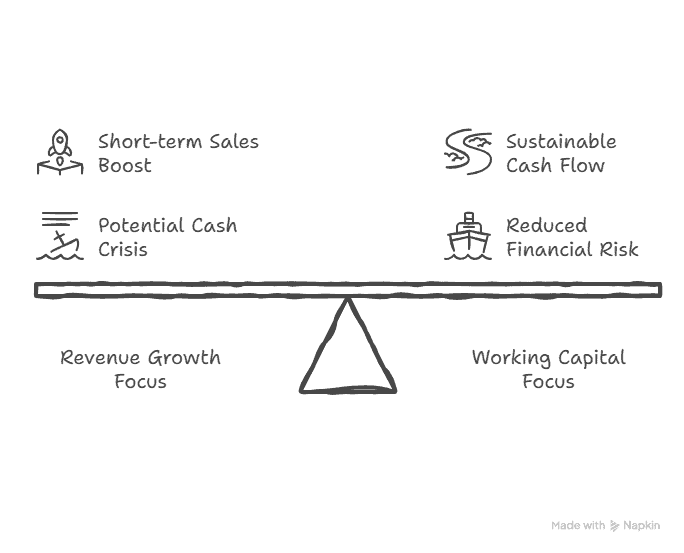
This pattern repeats across hundreds of CPG brands. Companies celebrate revenue growth while ignoring the capital requirements of that growth. By the time working capital problems become obvious, the brand is already in crisis mode, scrambling for emergency financing at terrible terms or cutting growth investments that tank momentum.
Understanding the Cash Conversion Cycle
Working capital management starts with understanding your cash conversion cycle: how long capital is tied up between when you pay suppliers and when you collect from customers.
CCC Formula: Cash Conversion Cycle = DIO + DSO – DPO
Days Inventory Outstanding (DIO): Average number of days inventory sits before selling. Days Sales Outstanding (DSO): Average number of days after shipping before collecting payment. Days Payable Outstanding (DPO): Average number of days between receiving supplier invoices and paying them.
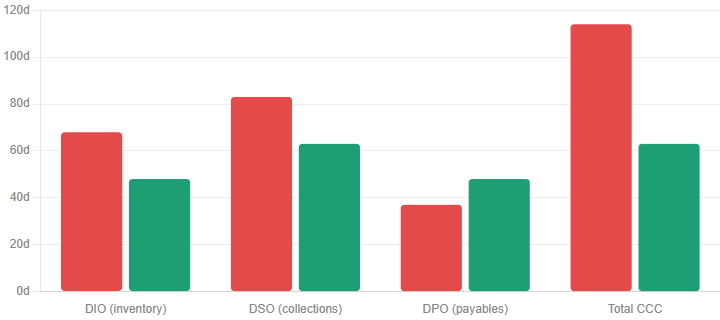
For the beverage brand mentioned above: DIO was 68 days (slow inventory turns of 5.4x), DSO was 83 days (retailers paying late plus deduction delays), and DPO was 37 days (co-packer requiring payment net-30, ingredients net-35). CCC: 68 + 83 – 37 = 114 days. Every dollar of revenue required 114 days of financing. At $22M annual revenue running at $1.83M monthly, they needed $1.83M x (114/30) = $7.0M in working capital just to operate at the current scale. They had $4.2M. The $2.8M shortfall manifested as chronic cash crises, missed payments, and the inability to fund growth.
Improving working capital means reducing CCC through faster inventory turns, faster collections, slower payments, or ideally all three simultaneously.
Understanding Your True Cost Structure
Most CPG companies operate without visibility into their actual cost structure, and it costs them millions. In practice across the consumer goods sector, too many brands can tell you their gross margin to the penny but cannot pinpoint whether their $2.3 million in overhead is driving growth or burning cash.
Consider a recent CPG client: they knew raw materials represented 47% of COGS, but they had zero visibility into why their packaging costs had jumped 23% quarter-over-quarter. The cost structure is not just about categorizing expenses into direct and indirect buckets. It is about understanding the operational levers that actually move your P&L.
Here is how sophisticated cost structure analysis transforms operations. For a specialty foods manufacturer, dissecting $847,000 in monthly raw material spend revealed they were paying 31% more for organic wheat because of fragmented purchasing across three suppliers. The result was $180,000 in annual savings through consolidated sourcing. Their distribution costs told an even more compelling story. Of $1.2 million in annual logistics expenses, 67% of shipments were going to retailers within a 200-mile radius, where truck utilization could be optimized. Even more revealing: their premium product line was actually subsidizing their mass market offerings by $2.47 per unit due to shared production inefficiencies.
This level of cost transparency fundamentally shifts your negotiating position with both suppliers and retail partners. When you walk into a supplier meeting knowing that every 1% improvement in raw material costs translates to $83,000 in annual margin expansion, you are not just negotiating; you are architecting profitability. One manufacturing client increased their EBITDA by 340 basis points over 18 months, not through top-line growth, but through surgical cost structure optimization.
Inventory Optimization: The Largest Working Capital Lever
Inventory typically represents 50 to 70% of total working capital in CPG, making it the highest-impact optimization opportunity.
Most brands carry too much inventory in the wrong places for the wrong reasons:
- Overestimating demand: forecasts based on optimism rather than POS data lead to excess inventory builds
- Safety stock paranoia: fear of stockouts drives excessive buffer inventory well beyond what variability requires
- Production economics: making large batches to hit co-packer MOQs ties up capital for months
- Slow-moving SKUs: maintaining full distribution on slow movers traps capital in inventory that turns twice per year
- Poor allocation: spreading inventory evenly across channels rather than concentrating in high-velocity outlets
Calculating Inventory Turns by SKU: Inventory Turns = Annual COGS / Average Inventory Cost
Rebuilding the inventory model for a condiment brand with 4.1x average turns revealed the following at the SKU level. The top 6 SKUs driving 72% of revenue had 8.2x turns — good performance. Middle 8 SKUs at 19% of revenue had 3.4x turns — acceptable but improvable. Bottom 9 SKUs at 9% of revenue had only 1.6x turns, tying up $290K in capital. The bottom 9 SKUs generated $78K annual gross margin while consuming $290K average inventory, a 0.27x GMROI. They were value-destroying. Discontinuing them freed $290K in working capital that funded growth in high-turn SKUs, improving blended turns to 6.8x and reducing total inventory 31% despite 14% revenue growth.
Healthy Inventory Turns by Product Type
| Product Category | Target Turns | Days in Inventory | Working Capital Risk |
| Refrigerated (short shelf life) | 10x – 15x | 24–36 days | Very low when managed |
| Shelf-stable (moderate velocity) | 6x – 10x | 36–60 days | Low to moderate |
| Slow-moving specialty items | 3x – 6x | 60–120 days | Moderate |
| Problem inventory (below 3x) | Under 3x | 120+ days | High — immediate action |
| Value-destroying SKUs | Under 2x | 180+ days | Critical — discontinue review |
Right-Sizing Safety Stock Without Causing Stockouts
Most CPG brands set safety stock using arbitrary rules of thumb such as “two weeks of inventory” or “10% of average stock.” These methods either leave you chronically out of stock or drowning in excess inventory.
Proper safety stock calculation accounts for both demand variability and lead time variability. Safety Stock = Z-score x sqrt(Lead Time x Demand Variance + Average Demand squared x Lead Time Variance).
For a SKU with an average demand of 4,000 units per month, a demand standard deviation of 800 units, a lead time of 45 days, a lead time standard deviation of 6 days, and a 97% target service level (z-score 1.88): Safety Stock = 1.88 x sqrt(1.5 months x 640,000 + 16,000,000 x 0.0025) = 1,880 units. At $1.20 COGS, that is $2,256 in safety stock for this SKU. If the brand had been carrying “four weeks” due to stockout paranoia, they would have $4,800 tied up unnecessarily, with $2,544 freed for other uses.
Across a 30-SKU portfolio, moving from arbitrary safety stock rules to calculated safety stock typically reduces inventory by 12 to 18% while actually improving service levels.
Optimizing Production Batch Sizes
CPG brands face constant tension between production economics and working capital efficiency. Larger production runs reduce per-unit costs through better line efficiency and ingredient purchasing, but they tie up more capital for longer periods.
The trade-off analysis compares two factors. Production Cost Savings: If producing 8,000 units costs $1.42 per unit but producing 15,000 units costs $1.31 per unit, the savings are $0.11 per unit or $1,650 per production run. Inventory Carrying Cost: If producing 15,000 instead of 8,000 means carrying an extra 7,000 units for 45 days at 20% annual carrying cost, the carrying cost is 7,000 x $1.31 x 0.20 x (45/365) = $226.
In this example, producing larger batches makes sense: $1,650 savings versus $226 carrying cost nets a $1,424 benefit. But for a slower-moving SKU selling 1,200 units per month, where producing 8,000 units means 6.7 months of inventory, the analysis shifts. The same production savings of $1,650 now face a carrying cost of $1,007. The net benefit drops to $643, and with 6.7 months of inventory against an 18-month shelf life, obsolescence risk increases significantly.
The strategic principle: high-velocity SKUs warrant larger production runs for cost savings. Slow-moving SKUs should produce closer to minimum batches to preserve capital, even if per-unit economics are slightly worse.
Accelerating Collections and Managing DSO
Days Sales Outstanding measures how long revenue sits in receivables before converting to cash. Most CPG brands accept retailer payment terms without negotiation, leading to 60 to 90-day DSO that strains cash flow.
Understanding Current Performance by Customer means calculating DSO by major retailer. Consider Kroger at 52 days (contractual 45 days plus 7 days processing delay), Walmart at 68 days (contractual 60 days plus 8 days delay), Target at 71 days (contractual 60 days plus 11 days delay), and a Regional Chain at 89 days (contractual 45 days plus 44 days delay). The regional chain is paying 44 days late versus contract terms.
Implementing an aggressive collections process makes a measurable difference:
- Day 46 (one day past due): Automated email reminder
- Day 51: Phone call from AR specialist
- Day 56: Escalation to the customer controller
- Day 61: Hold shipments until payment is received
- Day 66: Formal demand letter
Most brands wait until 30 to 45 days past due before serious collection efforts. This signals that late payment is acceptable. Aggressive early collections reduce average DSO by 8 to 12 days across the portfolio. Even small improvements compound significantly. Reducing DSO from 75 days to 63 days on $20M annual revenue frees $657K in working capital: ($20M / 365 days) x 12 days = $657K.
Eliminating Deduction Lag
Retailer deductions create a particularly damaging working capital drain. You ship product, book revenue, but actual cash collected is lower due to deductions for promotions, damaged goods, shortages, pricing disputes, and other claims.
The problem compounds because deductions settle 60 to 120 days after shipment. You are carrying receivables at gross value while the actual collectible amount is 15 to 25% lower. For a brand shipping $1.5M monthly with an 18% average deduction rate and 75-day deduction settlement time: Booked Receivables are $1.5M x 2.5 months = $3.75M, Actual Collectible is $3.75M x 0.82 = $3.075M, and the Deduction Lag Gap is $675K. They are carrying $675K more receivables on their balance sheet than cash they will actually collect, distorting working capital and cash flow forecasting.
Reducing deduction lag requires proactive validation by pulling promotional settlement data from retailer portals weekly and booking accruals immediately. Aggressive disputation of invalid or duplicative deductions is equally important. Reducing invalid deductions from 8% to 3% of total saves meaningful cash. For large promotions, requesting that promotional funding be deducted from the invoice at the time of shipment eliminates the settlement lag entirely. The beverage brand implemented aggressive deduction management and reduced its settlement lag from 92 days to 54 days, freeing $240K in working capital.
Extending Payables Strategically
Days Payable Outstanding measures how long you take to pay suppliers. Extending DPO improves working capital by keeping cash in your business longer, but requires strategic balance to avoid damaging supplier relationships or losing early payment discounts.
Current DPO by major supplier category as an example: Co-Packer at 32 days (terms are net-30, paying slightly slow), Ingredients at 28 days (terms are net-30, paying early), Packaging at 42 days (terms are net-45, paying early), Freight at 38 days (terms are net-30, paying slow), and 3PL at 18 days (terms are net-15, paying on time).
Optimization opportunities include negotiating extended terms by asking the co-packer and major ingredient suppliers for net-45 or net-60 terms. Stop paying early if terms are net-30, and you are paying in 20 days, you are providing free financing to suppliers. Pay on day 30 unless early payment discounts exceed your cost of capital. When evaluating early payment discounts, if a supplier offers 2% for payment in 10 days versus net-30, the annualized return is 37%. Take those discounts almost always. Extending the beverage brand’s DPO from 37 days to 48 days improved working capital by: ($22M annual COGS / 365 days) x 11 days = $663K. This single change freed $663K in working capital, funding four additional months of growth.
Channel and Customer Mix Impact on Working Capital
Different channels have dramatically different working capital profiles. Strategic channel prioritization based on working capital efficiency can improve cash flow without revenue trade-offs.
Working Capital Profiles by Channel
| Channel | Payment Terms | Inventory Velocity | Trade Spend | WC Efficiency |
| Convenience (DSD) | Net-21 | 12x turns | 8% of gross sales | Excellent |
| National Grocery | Net-45 to Net-60 | 7x turns | 18% of gross sales | Moderate |
| Club Stores | Net-60 | 4x turns | 26% of gross sales | Poor |
| E-commerce | Net-7 to Net-30 | Variable | 12–18% of gross sales | Moderate |
Growing convenience distribution improves working capital position. Growing club distribution strains it. Both might show similar gross margin percentages, but the cash cycle implications differ dramatically. When working capital is constrained, prioritize channels with faster payment terms, higher inventory turns, and lower trade spend. Recognize that growth in working-capital-intensive channels requires more financing than growth in working-capital-efficient channels.
Building Working Capital Forecasting Into Financial Models
Most CPG financial models forecast P&L carefully but treat working capital as an afterthought. This leads to businesses that look profitable on paper but run out of cash in reality.
Proper financial forecasting integrates working capital projections on a monthly basis. Revenue forecast is standard practice. Inventory is projected based on the COGS forecast and target turns by SKU. Receivables are projected based on sales forecast and DSO by customer. Payables are projected based on COGS and expense forecast with DPO by supplier type.
The resulting month-by-month cash flow model reveals cash crunches before they occur. If the model shows $180K ending cash in July against $620K in payables due in August, you know in March that you have a problem and can address it proactively through customer prepayments, extended terms, credit line expansion, or managed growth slowdown. The beverage brand implemented 13-week cash flow forecasting with working capital modeling and identified its cash crisis eight weeks before it would have occurred. This advance warning let them secure a $450K AR facility and negotiate extended terms with their co-packer, averting the crisis entirely.
Working Capital Improvement ROI
The financial return on working capital improvement often exceeds the return on revenue growth alone.
Scenario 1: Revenue Growth Focus: Grow revenue 35% from $15M to $20.25M while maintaining current working capital efficiency (CCC of 95 days). The $5.25M revenue increase requires $1.37M in additional working capital. At 25% EBITDA margins, that generates a $340K return on $1.37M investment, equal to a 25% ROI.
Scenario 2: Working Capital Improvement Focus: Hold revenue flat at $15M and improve CCC from 95 days to 65 days through inventory optimization and faster collections. The result is $1.23M freed from working capital (30 days x $15M / 365) with no additional investment required.
The second scenario generates capital freed without additional financing and without the execution risk of growth initiatives. Improving working capital efficiency can directly enhance profit margin by reducing financing needs and increasing operational efficiency, which leads to greater overall profitability. Most CPG brands should pursue both: improve working capital efficiency while growing revenue. This combination of funds grows partially through operational improvement rather than requiring full external financing, creating a more sustainable and resilient business model.
FAQ
What’s a healthy cash conversion cycle for CPG brands?
Target 45-75 days depending on business model. Premium refrigerated brands might run 45-60 days with fast turns and quick payment. Shelf-stable brands with club distribution might run 70-90 days and still be healthy. Above 100 days indicates problems requiring attention.
How do I reduce inventory without causing stockouts?
Move from arbitrary safety stock rules to calculated safety stock based on actual demand and lead time variability. This typically reduces inventory 15-20% while improving service levels because capital concentrates where variability justifies it.
What if suppliers won’t extend payment terms?
Focus on other levers: faster collections, better inventory management, production batch optimization. Also consider whether you can offer suppliers guarantees (minimum volumes, long-term commitments) in exchange for extended terms.
Should I take early payment discounts from suppliers?
If the discount exceeds your cost of capital, yes. A 2% discount for paying 20 days early represents 36% annualized return—take it. A 0.5% discount for 10 days early is 18% annualized—evaluate against your actual capital cost.
How do I handle retailers who systematically pay late?
Implement aggressive collections starting day one past due. Hold shipments if payment exceeds 15 days late. Consider factoring receivables from chronic late payers or adding late payment fees to terms. Some retailers respond only to enforcement.
What’s more important—inventory turns or gross margin?
Both matter, but GMROI (which combines them) is the right metric. A SKU with 45% margin at 4x turns generates 1.8x GMROI. A SKU with 35% margin at 10x turns generates 3.5x GMROI—better return on capital despite lower margin percentage.
Should I cut product lines to improve working capital?
Slow-moving SKUs below 3x turns that generate low GMROI are strong candidates for elimination. This frees working capital for high-return SKUs. But evaluate strategic value—some slow movers serve important portfolio roles.
How do deductions affect working capital?
Deductions create timing gaps between booked revenue and collected cash. If you ship $100K but deductions are $20K settling 90 days later, you’re carrying $20K more receivables than you’ll actually collect for three months. Proactive accrual and aggressive settlement reduce this gap.
What if I need to grow but don’t have working capital?
Prioritize working-capital-efficient channels and customers. Negotiate better payment terms with suppliers. Implement AR factoring or inventory financing. Slow growth rate to match available capital. Raising equity or debt might be necessary for aggressive growth.
How quickly can working capital improvements generate cash?
Inventory optimization shows results in 60-90 days as you work through excess stock. Payment term extensions with suppliers show immediate impact. Collections improvement takes 30-60 days. Full working capital transformation typically requires 4-6 months for complete impact.
How do I reduce costs in my CPG business?
To reduce costs, focus on optimizing ingredient sourcing, streamlining production, and improving supply chain efficiency. It’s important to reduce expenses wherever possible, and, when necessary, raise prices to maintain profitability in the face of rising costs.
How can CPG companies optimize costs in the food industry while maintaining quality?
In the food industry, cost optimization requires balancing cost reductions with maintaining food quality and operational efficiency. Strategies include reformulating recipes to use more cost-effective ingredients, improving supply chain processes, and leveraging technology for better cost visibility, all while ensuring that product standards and consumer expectations are met.
How do execution costs, shelf space, and store shelves impact working capital and profitability?
Execution costs related to retail shelf management, such as compliance tracking and merchandising, can significantly affect operational expenses. Maximizing shelf space and ensuring strong product placement on store shelves are critical for product visibility and sales performance, directly impacting working capital and overall profitability.
How should CPG brands respond to supply chain disruptions and volatile commodity prices?
To address supply chain disruptions and fluctuating commodity prices, CPG brands should focus on operational excellence and align supplier management with broader strategic objectives. Building resilient supplier partnerships, monitoring commodity price trends, and maintaining flexibility in sourcing help ensure business continuity and support long-term growth.
