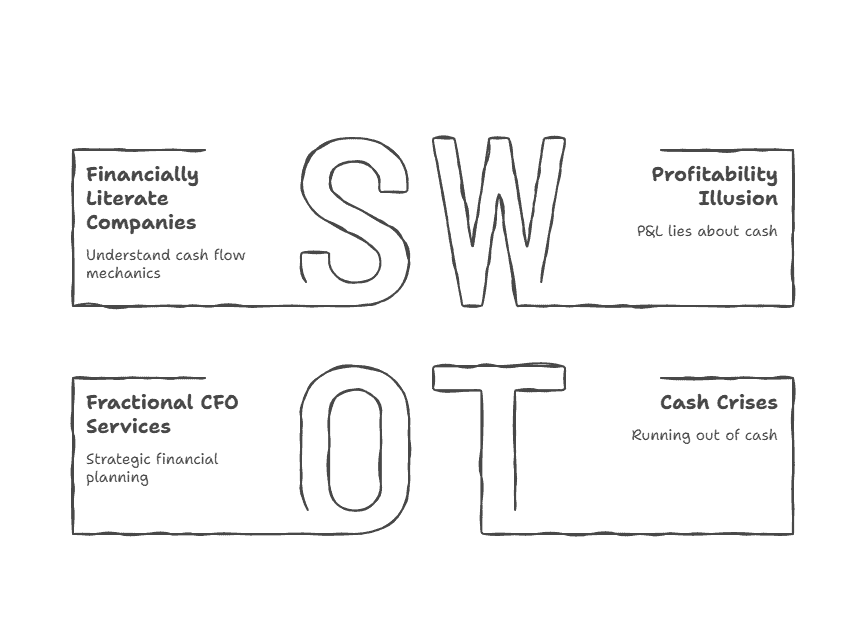
Cash Flow Forecasting for Profitable Companies: Why EBITDA Doesn’t Pay Bills
Your P&L shows $400,000 in profit. Your bank account shows $80,000 and dropping. How is this possible? This scenario—profitable on paper, running out of cash in reality—destroys more growing businesses than any other financial dysfunction. We’ve seen it dozens of times: companies with strong margins, growing revenue, and positive EBITDA facing payroll crises, vendor payment delays, or emergency loan scrambles.
The disconnect between profitability and cash isn’t an accounting error. It’s a fundamental misunderstanding of how businesses actually consume and generate cash. Often, a lack of understanding or optimization of existing financial processes contributes to this gap. Your income statement measures economic profit (revenue minus expenses in a period), but your bank account measures cash reality (money in minus money out). These are different things, and the gap between them can kill your business.
The companies that avoid cash crises aren’t necessarily more profitable than those that experience them—they’re just financially literate about the mechanics of cash flow. A finance professional, such as a fractional CFO, can help interpret and manage the complexities of cash flow versus profitability. They understand that revenue recognition doesn’t equal cash collection, that expenses on your P&L don’t always match cash outlays, and that growth typically consumes cash before it generates it.
TL;DR: Profitable companies can and do run out of cash because profitability (income statement) measures different things than cash generation (cash flow statement). The most common cash traps: fast growth consuming working capital, capital expenditures not appearing on P&L, debt payments not being expenses, timing differences between revenue recognition and cash collection, and inventory investment not flowing through the income statement. Accurate financial data is essential for identifying and preventing these cash flow issues. This guide covers the cash flow forecasting system that prevents crises, the working capital mechanics most businesses ignore, how to model cash consumption during growth, and the early warning indicators that signal cash problems before they become emergencies.
The Profitability Illusion: Why Your Financial Reporting and P&L Lie About Cash
Your income statement measures profit using accrual accounting: revenue is recognized when earned (not when cash is collected), and expenses are recorded when incurred (not when cash is paid). This creates temporal gaps between profit and cash. Understanding financial statements—such as the income statement, cash flow statement, and balance sheet—is essential to avoid confusion between profit and actual cash position.
Example 1: The Growth Company
– Closes $500,000 in sales in October (recognized as revenue immediately) – Customers pay in 45 days average (cash arrives in mid-December) – Pays employees and vendors in 15 days (cash out in mid-October)
October P&L shows $500,000 revenue and perhaps $150,000 profit. October cash flow shows $0 cash in from that revenue but $350,000 cash out for expenses. The company is profitable but burning $350,000 in cash—covered by their bank balance until it runs out. Interpreting this scenario correctly requires accounting expertise to understand how timing differences impact both profit and cash flow.
Example 2: The Inventory Business
– Buys $200,000 in inventory in September to meet Q4 demand – Sells that inventory in November for $340,000 (gross margin: 41%) – Customers pay in December
September cash flow: -$200,000 (inventory purchase) September P&L: $0 impact (inventory is an asset, not an expense) November P&L: $140,000 gross profit November cash flow: $0 (customers haven’t paid yet) December cash flow: +$340,000 (customers pay)
Across September through December, the business is profitable ($140,000 gross profit), but cash flow is negative until December. Without sufficient cash reserves or a line of credit, this profitable business could face a cash crisis in October or November. Proper accounting expertise is needed to interpret how inventory purchases and sales flow through the financial statements and affect both profit and cash.
Example 3: The Capital Investment
– Manufacturing company invests $300,000 in new equipment in March – Equipment enables $600,000 in additional annual revenue at 40% gross margins – Equipment is depreciated over 7 years ($43,000 annual depreciation)
March cash flow: -$300,000 (equipment purchase) March P&L: -$3,600 (first month’s depreciation, not the full $300,000) Annual P&L impact: -$43,000 depreciation vs. +$240,000 additional gross profit = $197,000 incremental profit
The business looks extremely profitable on the P&L ($197,000 incremental profit) but experienced a massive cash outflow ($300,000) that doesn’t appear as an expense. Again: profitable on paper, potential cash crisis in reality.
These are complex financial concepts that often require clear explanation for business owners and stakeholders to ensure informed decision-making.
The Working Capital Cash Trap
Working capital—the cash required to fund day-to-day operations—is the most common reason profitable companies run out of cash. Effective financial operations are critical to managing working capital, ensuring that cash is available when needed for ongoing business activities. Working capital has three components that move in opposite directions for cash flow:
Accounts Receivable: The Growth Tax
When you make a sale, you recognize revenue immediately on your P&L. But if you’re a B2B business with net 30 or net 45 payment terms, you won’t collect cash for 30-60 days. During growth, accounts receivable increases faster than you collect cash, creating a cash consumption cycle.
A services company grows from $200,000 to $300,000 in monthly revenue (50% growth). With 45-day payment terms (DSO), their accounts receivable increases from $300,000 to $450,000—a $150,000 increase in cash tied up in receivables. That $150,000 is revenue you’ve earned and shown on your P&L, but it’s not in your bank account. It’s cash you’ve essentially loaned to your customers.
Fast growth accelerates this problem. If you’re growing 30% annually with 45 DSO, you’re constantly increasing the cash tied up in receivables. This is “good” growth, but it consumes cash until growth stabilizes.
Inventory: Cash on Shelves
For product-based businesses, inventory represents cash spent on goods not yet sold. When you buy inventory, cash leaves your bank account immediately. The inventory sits on your balance sheet as an asset (not an expense), so your P&L is unaffected. Only when you sell the inventory does cost of goods sold appear on your P&L.
A distribution company projects revenue growth from $2M monthly to $3M monthly. They carry 60 days of inventory (5x annual inventory turns). At $2M monthly revenue with 40% gross margins, their monthly COGS is $1.2M, requiring $2.4M in inventory (60 days). When revenue hits $3M monthly, COGS increases to $1.8M monthly, requiring $3.6M in inventory—an increase of $1.2M in cash tied up in inventory.
A company’s business model significantly influences its working capital structure, determining how much cash is tied up in inventory and receivables based on sales cycles, payment terms, and supply chain requirements.
This $1.2M cash outflow doesn’t appear anywhere on their P&L. It’s not an expense; it’s a balance sheet change. But it’s absolutely real cash that left their bank account.
Accounts Payable: Your Free Financing
Accounts payable works in your favor—it’s cash you owe vendors but haven’t paid yet. If your vendors give you net 30 terms, you’ve received goods or services but kept the cash in your bank for 30 days.
During growth, AP increases, which actually helps cash flow. If your monthly expenses grow from $400,000 to $600,000 and your DPO (days payable outstanding) is 30 days, your AP balance increases from $400,000 to $600,000—that extra $200,000 is cash you’re holding onto temporarily, helping fund growth.
Strong financial management is essential to monitor and optimize working capital, helping prevent cash flow issues that can arise as your business grows.
The Working Capital Formula
Working Capital = Accounts Receivable + Inventory – Accounts Payable
Changes in working capital directly impact cash flow:
– Increasing AR = cash consumed
– Increasing inventory = cash consumed
– Increasing AP = cash generated (you’re delaying payment)
A company growing from $24M to $36M annual revenue (50% growth) with:
– 45 days sales outstanding (DSO)
– 60 days inventory on hand
– 30 days payable outstanding (DPO)
Working capital change:
– AR increase: $3M (45 days of higher revenue)
– Inventory increase: $2M (60 days of higher COGS)
– AP increase: $1M (30 days of higher expenses)
– Net working capital consumed: $4M
This company will consume $4M in cash funding working capital expansion despite being profitable. If they’re generating $3M in annual profit, they’ll actually be net cash-flow negative by $1M during the growth year—profitable on the P&L but needing financing or cash reserves to fund growth. Financial plans should proactively account for these working capital fluctuations to ensure sufficient liquidity and support strategic objectives.
A robust finance function, whether managed internally or through a fractional CFO, plays a critical role in monitoring and managing working capital to maintain healthy cash flow and enable sustainable growth.
Financial Foundation and Oversight
The reality is that most businesses I encounter have solid revenue streams but shaky financial foundations—and the difference shows up in their ability to scale. Consider a $12 million manufacturing client I worked with last year: strong margins, growing market share, but cash flow swings that kept the CEO awake at night. What they needed wasn’t just accurate bookkeeping (though that’s table stakes). They needed proactive financial oversight that could turn daily operational data into strategic advantage.
Here’s where fractional CFO services transform the equation entirely. In my CFO travels, I’ve seen businesses unlock 23-31% improvements in cash predictability within 90 days—not through magic, but through the kind of high-level financial leadership that most companies assume requires a $250K+ salary commitment. By partnering with experienced financial professionals like myself, businesses gain access to strategic financial planning that’s calibrated to their specific operational realities. I work directly with management teams to design financial strategies that don’t just align with business objectives—they accelerate them. Every financial decision becomes a calculated move toward sustainable growth rather than a hopeful guess.
Effective cash flow management sits at the core of everything else that matters financially. The sophistication extends to monitoring patterns most business owners never see: that 14-day lag between invoice approval and payment processing, or the $47,000 monthly variance that emerges from seasonal inventory cycles. I help businesses forecast these patterns with precision, optimize working capital deployment, and build the confidence needed to invest in opportunities when they appear. What’s particularly fascinating is how refined financial processes and strengthened internal controls create compound effects—clearer reporting leads to faster decisions, which generates better outcomes, which improves stakeholder confidence across the board.
Ultimately, leveraging fractional CFO services means accessing the financial expertise that transforms businesses from reactive to strategic. With the right financial leadership in place, you gain something invaluable: the freedom to focus on what you do best—growing your business—while knowing your financial foundation can support whatever comes next. Result: sustainable competitive advantage built on operational excellence rather than crossing your fingers and hoping the numbers work out.
Building a Cash Flow Management and Forecasting System
Cash flow forecasting isn’t optional for growing businesses—it’s the early warning system that prevents crises. Here’s how to build a system that actually works:
Baseline Your Current Cash Cycle
Document your actual cash timing:
– Days sales outstanding (DSO): How long until customers actually pay? Don’t use your payment terms (net 30); use actual average collection time. Pull your AR aging and calculate: (Total AR / Average Daily Revenue). A company with $450,000 in AR and $300,000 monthly revenue has 45 DSO. – Days inventory on hand: For product businesses, how long does inventory sit before selling? Calculate: (Inventory Balance / Average Daily COGS). A company with $800,000 in inventory and $400,000 monthly COGS has 60 days of inventory. – Days payable outstanding (DPO): How long until you actually pay vendors? Calculate: (Total AP / Average Daily COGS or Expenses). A company with $250,000 in AP and $500,000 monthly expenses has 15 DPO.
Your cash conversion cycle = DSO + Inventory Days – DPO. This tells you how many days of cash you have tied up in operations. A company with 45 DSO + 60 inventory days – 15 DPO has a 90-day cash conversion cycle—they’re financing 90 days of operations out of their own cash.
Leveraging accounting software at this stage can streamline the process of gathering accurate data for cash flow forecasting, ensuring you have up-to-date and reliable numbers.
Week 3-4: Build Your 13-Week Cash Flow Model
Create a rolling 13-week (approximately 3-month) cash flow forecast updated weekly. This is your early warning system.
Start with cash balance: Begin with actual bank balance today.
Add cash inflows:
– Collections from AR (based on actual DSO patterns, not invoices) – New sales that will be collected during the 13-week window – Other income (asset sales, financing, etc.)
Subtract cash outflows:
– Payroll (every pay period, precisely dated) – Vendor payments (based on actual DPO, not invoice due dates) – Rent and fixed expenses (on actual payment dates) – Loan payments (principal + interest, on schedule) – Tax payments (quarterly estimates, annual payments) – Capital expenditures (equipment, vehicles, software) – Owner distributions
Calculate ending cash balance each week.
Cash flow optimization is a key objective of this forecasting system, helping you proactively manage liquidity and improve operational efficiency.
The first time you build this, you’ll discover your actual cash cycle. A consulting firm believed they had 30-day collections. Their forecast revealed actual collections averaged 47 days, with larger clients paying in 60+ days. This insight led to revised payment terms and more aggressive collections processes.
Monthly: Extend to 12-Month Rolling Forecast
Your 13-week forecast shows immediate cash position. Extend this to 12 months to identify longer-term cash constraints.
Monthly granularity is sufficient beyond 13 weeks. The 12-month forecast reveals:
– Seasonal cash patterns (many businesses have Q4 cash consumption, Q1 collections) – Growth-driven working capital needs – Capital expenditure timing – Financing requirements
A product company’s 12-month forecast showed them hitting negative cash in month 8 of their growth plan despite profitable P&L projections. This led to securing a $500,000 line of credit in month 3 (when they had strong cash position and borrowing was easy) rather than scrambling for emergency financing in month 8.
Building accurate and actionable forecasts requires financial and accounting expertise to interpret the data, identify trends, and guide strategic decisions.
Common Cash Flow Mistakes and How to Avoid Them
Mistake 1: Confusing Revenue with Cash
Never assume revenue equals cash collected in the same period. For B2B businesses with 30-60 day payment terms, cash lags revenue by 1-2 months. Model cash collections based on actual DSO, not invoice dates. Incorporating risk management practices can help avoid these common pitfalls by ensuring your financial planning accounts for timing discrepancies and potential collection issues.
Mistake 2: Ignoring Timing of Large Payments
Annual insurance premiums, quarterly tax payments, annual software subscriptions—these create cash spikes that don’t appear as unusual expenses on your monthly P&L. A $48,000 annual insurance premium is $4,000 monthly on your P&L but a $48,000 cash outflow in one month.
Build a “lumpy cash” schedule tracking all non-monthly payments: property taxes, insurance renewals, annual subscriptions, quarterly bonuses, equipment maintenance contracts.
Mistake 3: Treating Debt Principal as an Expense
Your P&L shows interest expense (the cost of borrowing) but not principal repayment (paying down the loan balance). However, principal payments absolutely affect cash.
A company with a $500,000 loan at 8% interest on a 5-year amortization pays approximately $10,100 monthly. Their P&L shows ~$3,300 monthly interest expense. Their cash flow shows $10,100 monthly cash outflow. The difference ($6,800 monthly principal repayment) doesn’t appear on the P&L but absolutely impacts cash.
Mistake 4: Underestimating Growth Cash Consumption
Rapid growth consumes cash through working capital expansion. A company growing revenue 50% annually will see AR and inventory increase substantially (assuming typical payment and inventory patterns), requiring cash investment that won’t appear as expenses. These financial challenges can quickly escalate if not properly managed, leading to liquidity issues even in profitable businesses.
Model working capital changes explicitly when forecasting growth scenarios. Don’t assume that a profitable growth plan is cash-flow positive—it often isn’t.
Mistake 5: Ignoring Seasonal Patterns
Many businesses have predictable seasonal cash patterns:
– Retail: cash consumption in Q3-Q4 (inventory build), cash generation in Q4-Q1 (holiday sales and collections) – B2B services: cash consumption in Q1 (slow sales, prior year collections), cash generation in Q4 (year-end projects) – Construction: weather-dependent cycles affecting project timing
Identify your patterns through historical analysis and build them into forecasts. A construction company discovered their cash balance always hit annual lows in February-March (slow season) and annual highs in September-October (peak collections). This insight led them to secure a seasonal line of credit used only in Q1-Q2, avoiding the high cost of year-round credit they didn’t need.
Seeking strategic guidance from a fractional CFO can help you implement effective risk management, navigate financial challenges, and proactively address these common cash flow mistakes.
The Early Warning Dashboard
Build a dashboard tracking these leading indicators of cash problems and overall financial performance:
Cash Runway: Months of cash remaining at current burn rate. Calculate: (Current Cash Balance / Average Monthly Cash Burn). If you have $200,000 cash and burn $40,000 monthly, you have 5 months runway. When runway drops below 6 months, you should be actively addressing cash generation or securing financing.
DSO Trend: Track days sales outstanding monthly. Increasing DSO (from 35 days to 42 days to 48 days) signals collections problems. A 10-day increase in DSO can consume $100,000+ in cash for a $3M revenue business.
Working Capital as % of Revenue: Calculate (AR + Inventory – AP) / Monthly Revenue. This should remain relatively stable. If it’s increasing (from 2.0x monthly revenue to 2.5x), you’re consuming cash in working capital. Effective management of working capital also relies on having strong internal controls.
Operating Cash Flow: Track cash from operations (revenue collections minus operating expense payments, excluding financing and capital expenditures). Negative operating cash flow despite profitability signals a cash problem developing.
13-Week Minimum Cash Balance: Your rolling 13-week forecast should show the minimum cash balance projected over the next quarter. If this number approaches zero or goes negative, you have 13 weeks to fix the problem before crisis hits.
Tracking financial performance through these dashboard metrics is essential for early detection of cash flow issues and helps ensure that financial strategies are effective and tailored to your company’s needs.
A software company’s dashboard showed DSO increasing from 38 days to 52 days over three months while revenue grew 25%. This was consuming $180,000 in additional cash. Early detection allowed them to implement new collections processes and identify that their largest new customer (15% of revenue) was systematically paying 75+ days. They negotiated improved payment terms before the situation became a crisis.
Business leaders rely on these dashboards to interpret financial data and make informed decisions that drive growth and profitability.
When Profitable Companies Need Financing and Fractional CFO Services
Cash flow challenges don’t always signal business problems—sometimes they signal growth success. Fast-growing, profitable businesses often need financing to fund working capital expansion. This is healthy and strategic, not a sign of failure. Raising capital, whether through debt or equity, can also be a strategic option for funding growth and supporting long-term business objectives.
Good reasons to finance cash flow include aligning financing decisions with your overall financial strategy:
– Funding working capital during rapid growth (30%+ annually)
– Seasonal inventory build (retail, distribution, manufacturing)
– Large project cash consumption (paying subcontractors/suppliers before client payment)
– Strategic capital expenditures enabling growth
– Bridging timing gaps between revenue growth and cash collection
Warning signs that financing masks business problems:
– Chronic negative operating cash flow despite profitability (suggests unit economics problems)
– Increasing DSO every quarter (collections problems or customer credit quality issues)
– Using credit lines to cover operating losses (not growth, but dysfunction)
– Borrowing to pay owner distributions while cash from operations is negative
A distribution company’s 12-month forecast showed they’d consume $800,000 cash funding inventory expansion to support projected 40% revenue growth. Their bank provided a $1M asset-based line of credit secured by inventory and receivables at prime + 2%. Cost: approximately $40,000 annually in interest. Benefit: enabled growth generating $400,000 incremental gross profit. This was excellent use of financing—the growth was profitable and the financing cost was small relative to incremental profit. By strategically leveraging financing as part of a comprehensive financial strategy, companies can overcome financial challenges and position themselves for sustainable growth.
Frequently Asked Questions
We’re profitable every month but our cash balance keeps declining—how long can this continue before it becomes a real problem?
This situation is unsustainable and will become a crisis when cash balance approaches zero, which could happen surprisingly quickly during growth. Calculate your cash runway (current balance divided by average monthly cash burn) immediately. If you have less than 6 months runway, you need to act now—either secure financing, reduce growth rate to lower working capital consumption, improve collections to reduce DSO, or negotiate extended payment terms with vendors to increase DPO. The most common cause of profitable companies running out of cash is growth consuming working capital faster than operations generate cash. Build a detailed 13-week cash flow forecast to see exactly when you’ll hit critical low cash points. A fractional chief financial officer or part time CFO can provide interim or ongoing support for cash flow forecasting and management, working closely with your finance team and accounting team to ensure you have the right financial guidance. Then decide: Is this growth worth financing (if incremental profit exceeds financing cost), or should you moderate growth to match cash generation capacity? Many businesses discover they can maintain profitability while growing more slowly in a way that’s cash-flow positive, avoiding the need for external financing entirely. High level financial expertise and strategic financial leadership from a fractional CFO can provide strategic financial guidance to small business owners and business leaders facing these challenges.
How much cash should we keep in reserves, and how do we know if we’re being too conservative by holding excess cash?
Minimum cash reserves should equal 2-3 months of operating expenses plus your maximum expected monthly cash consumption from working capital swings. For a business with $300,000 monthly operating expenses and potential $150,000 monthly working capital swings, maintain minimum $750,000-$1.05M in cash reserves. Beyond this safety buffer, the question becomes opportunity cost: what return could you generate deploying that cash in the business (growth investments, efficiency improvements, debt paydown) vs. holding it in reserves? If you’re consistently maintaining 8-12 months of cash reserves while having profitable growth opportunities or expensive debt, you’re probably being too conservative. However, conservative cash management is often appropriate for businesses with: volatile revenue (project-based, seasonal), high customer concentration (losing one large customer creates cash crisis), limited access to credit (can’t quickly secure financing if needed), or owners approaching retirement/exit (preserving value is priority over growth). The right answer depends on your risk tolerance and strategic priorities, but most healthy growing businesses should maintain 3-6 months of operating cash reserves plus access to a credit line for working capital management. Compared to a full time hire or in house CFO, hiring a fractional CFO offers significant cost savings and flexibility. Fractional CFO cost typically ranges from $5,000 to $15,000 per month, making it a more affordable option for small business owners and growing companies. Key differences between a fractional CFO and a full-time chief financial officer (CFO) include the ability to scale services to your business needs and avoid the high fixed costs of a permanent executive.
Should we forecast cash flow weekly, monthly, or quarterly, and how far forward should our forecasts extend?
Use a layered approach: 13-week rolling forecast updated weekly (your early warning system), 12-month rolling forecast updated monthly (strategic planning horizon), and 36-month annual forecast updated quarterly (for long-term planning, investor relations, or exit preparation). The 13-week weekly forecast is where you’ll catch problems early—it shows exactly when cash will tighten and gives you enough runway to solve problems before they become crises. This level of detail is essential for businesses with tight cash positions, rapid growth, or seasonal patterns. The 12-month monthly forecast is your strategic tool for planning capital expenditures, hiring decisions, and financing needs. The 36-month forecast is primarily for external stakeholders (investors, lenders, potential acquirers) and long-term strategic decisions. Updating frequency matters: if your 13-week forecast sits untouched for a month, it becomes useless. Weekly updates force discipline and catch deteriorating collection patterns or unexpected expense increases before they compound. Most cash crises could have been prevented with weekly cash forecasting updated religiously—the businesses that run out of cash are usually those that stopped looking at their forecast 6-8 weeks before the crisis hit.
There are several CFO models to consider for your business needs, including interim CFO, outsourced CFO, and fractional CFO offers. An interim CFO provides short-term leadership during transitions or crises, while an outsourced CFO can deliver strategic support on a flexible basis. Fractional CFOs often serve multiple clients and multiple companies, bringing broad experience and best practices to your organization. These finance leaders work alongside your finance team and accounting team to enhance financial management and decision-making. Hiring a fractional CFO can also support early-stage business development by providing high-level expertise without the commitment of a full-time executive, making it ideal for lean operational structures.

Salvatore Tirabassi is the Founder of CFOPro+Analytics, providing fractional CFO services to growth-stage companies. Based in New York, he leverages over 24 years of experience in venture capital and strategic finance to help entrepreneurs master cash flow, unit economics, and equity value creation through data-driven financial clarity.
Assess your CFO needs in 5-minutes
