The 9 Business Model Templates: How Financial Strategy Changes by Revenue Mechanics
Industry expertise matters less than most people think. After building financial models for manufacturers, SaaS companies, professional services firms, distributors, and many other business types, a consistent pattern emerges: businesses that look completely different on the surface often operate identically at the financial level.
A manufacturer selling industrial equipment and a software company selling enterprise licenses face remarkably similar financial challenges: long sales cycles, lumpy revenue, capacity constraints, and complex working capital management. Meanwhile, two software companies can have completely different financial dynamics if one uses a transactional self-service model and the other uses high-touch enterprise sales. Industry does not determine your financial strategy. Your revenue mechanics do.
This article categorizes businesses into nine fundamental business model templates based on how they make money, not what they sell. Each template has predictable financial patterns, common growth constraints, and specific strategic priorities.
Why Business Model Mechanics Matter More Than Industry
Consider a construction company and a software company operating side by side. On the surface, nothing in common. One deals with physical materials, labor, and job sites. The other deals with code, intellectual property, and cloud infrastructure. Yet their financial patterns were nearly identical.
Both had sales cycles of four to six months from initial contact to signed contract. Both experienced lumpy revenue from large deals closing unpredictably. Both operated on a project-based delivery structure with defined scope, timeline, and budget. Both were constrained by available skilled labor. And both dealt with revenue recognition complexity tied to percentage-of-completion accounting.
The financial strategies that worked for one worked for the other: improving sales cycle predictability through pipeline management, smoothing revenue volatility through minimum project sizes and retainer components, managing capacity through subcontractor networks, and tracking project-level profitability as a core discipline.
The manufacturer selling $50,000 industrial machines through a direct sales team is financially more similar to a software company selling $75,000 enterprise licenses than to a manufacturer selling $3 industrial components through distributors. Industry benchmarks are useful for context. Business model knowledge drives strategic decisions.
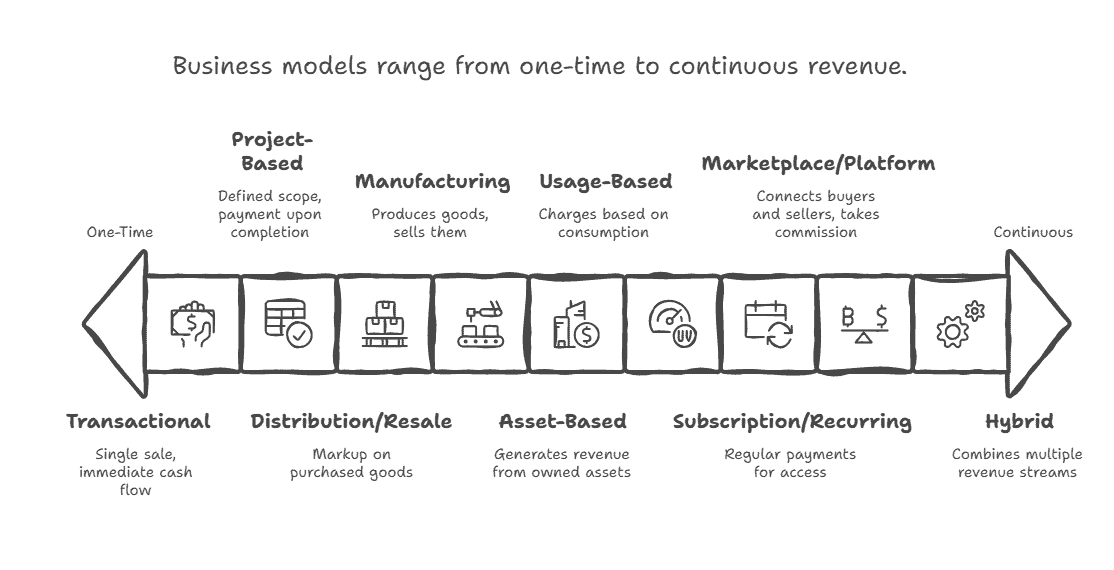
The Nine Business Model Templates
1. Transactional Model
The transactional model relies on high-volume, low-touch sales where customers discover, evaluate, and purchase with minimal human interaction. Common examples include e-commerce, retail, quick-service restaurants, mobile apps with in-app purchases, and self-service SaaS products priced under $50 per month.
Customer acquisition costs are low, typically between $5 and $50. Transaction values are modest, usually $20 to $500. High customer volume is required to build meaningful revenue. Customer lifetime value depends entirely on repeat purchase behavior, not contract duration.
The strategic priority in this model is unit economics by acquisition channel. Conversion rate optimization is core: every 1% improvement in conversion is pure margin. CAC to LTV ratio is existential. Repeat purchase rate separates profitable businesses from unprofitable ones. A practical example: a consumer products e-commerce company at $6 million in revenue was unprofitable because its customer acquisition cost of $47 exceeded its first-purchase gross profit of $41. They only became profitable on customers making two or more purchases, which was 32% of their base. The fix was shifting spend away from discount-driven channels with 12% repeat rates toward content-driven channels with 48% repeat rates. Revenue grew more slowly, but EBITDA margins improved from negative 8% to positive 14%.
2. Subscription and Recurring Revenue Model
Subscription businesses generate predictable periodic revenue from customers paying monthly or annually for continued access to a product or service. Common examples include SaaS platforms, membership businesses, subscription boxes, maintenance contracts, and managed services.
Customer acquisition costs are moderate to high, ranging from $200 to $5,000 or more. Churn is the primary business risk: 5% monthly churn compounds to roughly 46% annual revenue loss, which is catastrophic for growth targets. Expansion revenue from existing customers is the highest-margin growth lever available. Cash flow can be deeply negative during rapid growth because acquisition costs are paid upfront while revenue is recognized over months or years.
A B2B SaaS company at $4 million ARR was growing 40% annually but burning $800,000 per year while appearing near profitable on a standard P&L. The root cause: they recognized revenue monthly from annual contracts paid upfront while paying sales commissions on booking. Their cash flow told a different story. Rapid growth consumed cash because acquisition costs were paid before revenue was recognized. The solution was a credit facility to fund growth efficiently and a commission restructuring that paid partially on collection rather than entirely on booking.
3. Project-Based Model
Project-based businesses engage customers for defined work with specific scope, deliverables, budget, and timeline. Common examples include consulting, construction, custom software development, events, agency services, and architectural or engineering firms.
Revenue is episodic and project-specific. Revenue recognition is complex, often tied to percentage-of-completion or milestone delivery. Resource capacity constrains growth because billable hours or team availability create a hard ceiling. A digital marketing agency at $8 million in revenue had 22% overall EBITDA margins but project margins ranging from negative 15% to positive 48%. The lowest margins came from monthly retainer clients under $5,000 per month. The highest margins came from fixed-scope website development projects in the $25,000 to $75,000 range. After raising the minimum retainer to $8,000 and refocusing new business development on fixed-scope work, revenue declined 8% year over year, but EBITDA margins improved to 31%.
4. Distribution and Resale Model
Distribution businesses buy products from manufacturers or suppliers and sell them to customers at a markup, earning a margin on the spread. Profitability depends on volume, supplier relationships, and operational efficiency.
Gross margins are typically lower than those of other models, ranging from 20% to 40%. Inventory is the dominant working capital component. A distribution company with $18 million in revenue had 28% gross margins but only 3% net margins. Inventory turned 4.2 times annually, meaning 87 days of inventory on hand. Suppliers offered net 30 terms while customers paid in 42 days on average. This meant the company was financing 54 days of inventory with its own cash. Negotiating extended terms to net 45 from key suppliers reduced cash tied up in working capital by $340,000, freeing capital for a second warehouse that enabled further growth.
5. Manufacturing Model
Manufacturing businesses convert raw materials into finished products through production processes and sell them directly or through distribution channels. Gross margins are moderate, typically 35% to 55%. Fixed costs are high due to equipment, facilities, and overhead. Working capital intensity is significant because raw materials, work in progress, and finished goods inventory all consume cash simultaneously.
A component manufacturer with $14 million in revenue was operating at 78% capacity utilization with 42% gross margins. Projections showed that growth to $19 million would require new equipment costing $850,000. Detailed modeling revealed that efficiency improvements, specifically reducing scrap from 6% to 3.5% and improving setup times, could support $17 million in revenue without any capital investment. This delayed the equipment purchase by 14 months and improved cash flow by $920,000.
6. Marketplace and Platform Model
Marketplace businesses connect buyers and sellers and earn a commission or transaction fee on each exchange. Value compounds through network effects: more buyers attract more sellers, which attracts more buyers. Marginal cost per transaction is low once the platform is established.
A niche B2B marketplace connecting buyers and sellers in an industrial category was charging an 8% take rate on $12 million in gross merchandise value. Analysis revealed that buyers conducting large transactions above $50,000 were avoiding the platform to escape fees. Restructuring to a tiered take rate 12% on transactions under $10,000 and 6% on transactions above $50,000 reduced short-term revenue but increased large transaction volume. GMV grew to $18 million, and revenue improved to $1.26 million.
7. Usage-Based Model
Usage-based businesses charge customers based on consumption. Revenue scales automatically with customer success, which aligns incentives between provider and customer. Revenue can be volatile because customers reduce usage during downturns before canceling entirely.
A cloud infrastructure company had strong early adoption with over 200 customers in the first 18 months, but concerning unit economics. Average monthly customer value was $340, yet 35% of customers paid under $100 per month, well below the $450 customer acquisition cost. Data showed that customers crossing $500 monthly usage within six months typically grew to $2,000 or more per month within 18 months. The strategic response was targeting larger customers with clear expansion potential and implementing minimum monthly commitments. Average customer value improved from $340 to $780 without sacrificing acquisition efficiency.
8. Hybrid Model
Hybrid businesses combine multiple revenue models to create diversified streams that capture different forms of value. Common combinations include SaaS paired with professional services, subscription fees layered with usage charges, and product sales supported by recurring maintenance contracts.
A software company had $5 million in subscription revenue at 82% gross margins and $3 million in professional services revenue at 35% margins. Analysis showed that 70% of service revenue was implementation and training directly tied to new subscription customer onboarding, making it a cost of customer acquisition rather than a standalone business. The remaining 30% was custom development work unrelated to subscription growth. The decision to exit custom development reduced total revenue from $8 million to $7.2 million but improved overall EBITDA margins from 22% to 34%.
9. Asset-Based Model
Asset-based businesses generate revenue by renting, leasing, or charging for access to physical assets. Capital intensity is high and unavoidable. Fixed costs continue regardless of utilization. Debt financing is common because assets can serve as collateral, and leverage amplifies returns when utilization is strong.
An equipment rental company owned $4 million in equipment, generating $2.8 million in annual revenue at 70% overall utilization. Category-level analysis showed construction equipment running at 85% utilization while specialty tools averaged only 42%. Selling $600,000 of low-utilization specialty tools and reinvesting $900,000 in high-demand construction equipment improved overall utilization to 78% and increased annual revenue to $3.4 million without increasing the total asset base.
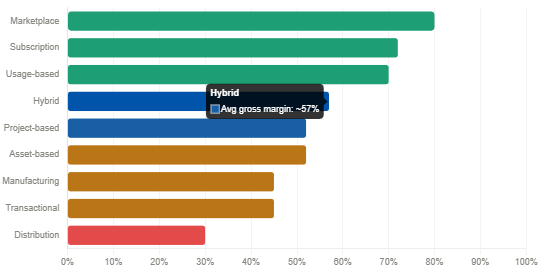
Business Model Templates: Key Financial Characteristics
| Business Model | Primary Revenue Driver | Gross Margin Range | Key Growth Constraint | Core Financial Metric |
| Transactional | Volume and repeat purchase | 30–60% | Acquisition channel saturation | CAC to LTV ratio by channel |
| Subscription | MRR growth and churn control | 60–85% | Cash burn during growth | Net revenue retention |
| Project-Based | Utilization and project margin | 40–65% | Billable capacity ceiling | Utilization rate + project margin |
| Distribution / Resale | Volume and supplier terms | 20–40% | Working capital exhaustion | Inventory turns + cash conversion |
| Manufacturing | Production efficiency | 35–55% | Capacity constraints | Capacity utilization + scrap rate |
| Marketplace | Take rate and GMV | 70–90% | Liquidity (buyer-seller balance) | GMV, take rate, repeat transactions |
| Usage-Based | Consumption growth | 60–80% | Infrastructure scaling costs | Net revenue retention + expansion |
| Hybrid | Cross-sell leverage | 45–70% | Resource allocation complexity | Profitability by revenue stream |
| Asset-Based | Asset utilization | 40–65% | Capital for asset acquisition | Utilization rate + ROA |
Applying Business Model Knowledge to Your Financial Strategy
Which Financial Metrics Actually Matter
Different models require different measurement priorities. A subscription business focused on inventory turns is measuring the wrong thing. A distribution business ignoring its cash conversion cycle is operating blind.
Transactional businesses need CAC and LTV by acquisition channel, conversion rate, and repeat purchase rate. Project-based businesses need utilization rate, project-level margin, and pipeline visibility. Subscription businesses need cohort retention, net revenue retention, and CAC payback period. Distribution businesses need inventory turns, days payable outstanding, and gross margin return on inventory investment. The financial dashboard should match the business model, not default to a generic template.
What Constraints Will Limit Your Growth
Each model has a predictable growth constraint that becomes binding as the business scales. Identifying it early enables proactive planning rather than reactive crisis management.
- Transactional businesses hit acquisition channel capacity
- Subscription businesses face cash flow constraints because growth is funded by upfront CAC before revenue is recognized
- Project-based businesses run out of billable capacity before they run out of demand
- Distribution businesses exhaust working capital
- Manufacturing businesses hit production capacity
- Marketplaces struggle with liquidity imbalances
- Usage-based businesses face infrastructure scaling costs
- Asset-based businesses run out of capital for asset acquisition
A project-based business experiencing a revenue plateau almost always faces a resource capacity constraint. The solution is not better marketing. It is strategic hiring, pricing increases to improve revenue per billable hour, or a deliberate shift toward larger, higher-margin engagements that use existing capacity more efficiently.
How to Structure Pricing for Maximum Profitability
Business model mechanics reveal which pricing structures work and which undermine profitability. Transactional models benefit from tiered pricing that increases purchase frequency. Subscription models should implement usage-based expansion pricing to capture value as customers grow. Project-based models generate better margins from value-based project fees than from hourly rates because clients focus on outcomes, not hours. Distribution models need volume-tiered pricing to incentivize larger orders. Marketplaces benefit from dynamic pricing during high-demand periods. A consulting firm that switched from hourly billing at $200 per hour to value-based project pricing saw its effective rate increase to $340 per hour while customer acceptance actually improved. Clients were willing to pay more for defined outcomes than for time.
Conclusion
Understanding your business model template is one of the highest-leverage moves available to any financial leader. It tells you which metrics to track, which constraints will bind your growth, and how to structure pricing and operations to maximize profitability.
The nine templates described here cover the vast majority of business structures encountered in practice. Most companies fit primarily into one template with secondary characteristics from another. Identifying your primary model and building a financial strategy around its specific mechanics rather than generic industry benchmarks is what separates reactive financial management from proactive strategic leadership.
Revenue mechanics, not industry, determine which financial decisions matter most. Build your financial model accordingly.
Frequently Asked Questions
Our business doesn’t fit cleanly into one template—we have both subscription revenue and project revenue. How should we think about financial strategy?
Hybrid models are increasingly common and often strategically advantageous, but they require careful financial segmentation. Track and model each revenue stream separately with appropriate metrics: your subscription revenue needs MRR/ARR tracking, churn analysis, and cohort retention metrics, while your project revenue needs utilization rates, project margins, and pipeline analysis. The strategic question becomes: how do these revenue streams support each other? Many SaaS companies do implementation services that are low-margin but drive subscription adoption and reduce churn—strategically valuable even if not independently profitable. Calculate fully-loaded profitability by stream, understand the customer journey between streams (do project customers convert to subscription? at what rate?), and make deliberate decisions about resource allocation. Some hybrid businesses discover one stream subsidizes another unintentionally—you want this to be a strategic choice, not an accident. A robust financial model calculates key metrics such as customer growth, profitability, and scenario outcomes for each stream, helping you make data-driven decisions.
We’re in a “traditional” industry (manufacturing, distribution) where competitors use cost-plus pricing, but you mentioned value-based pricing. How can we change pricing models when industry norms are established?
Industry pricing norms exist until someone breaks them successfully. The businesses that command premium pricing in “commodity” industries do so by changing the value proposition, not by being incrementally better at the traditional model. A distribution company competing on price will always face margin pressure—but a distribution company offering technical expertise, just-in-time delivery, inventory management services, and demand forecasting creates different value that justifies different pricing. Start with customer segmentation: which customers buy purely on price (probably not your target) vs. which customers value reliability, expertise, or additional services? Build your value-based offering for the second group. Implement gradually: test premium pricing with new customers or new product lines before changing existing customer relationships. Document the value you create: faster delivery saving customers production downtime, technical support preventing costly errors, inventory management reducing customer working capital. When you can quantify customer value created, you can justify pricing that captures a portion of that value rather than cost-plus margins. When presenting financials to investors or lenders, it is important to prepare a comprehensive financial plan that includes structured financial statements to clearly demonstrate your company’s financial health.
How do I know if we should stay focused on our core business model or add new revenue streams (moving from pure subscription to hybrid subscription + services, for example)?
Additional revenue streams should solve strategic problems or capture value you’re currently leaving on the table—not just chase revenue growth. Good reasons to add revenue streams: your core model has natural expansion limits (subscription business where implementation services drive adoption and reduce churn), you’re leaving money on the table (customers are hiring others to do work you could do profitably), or you need diversification to reduce volatility (project-based business adding retainer component for stability). Bad reasons: your core model isn’t profitable (adding complexity rarely fixes fundamental unit economics), you’re bored with your business (focus creates value; diversification often destroys it), or customers occasionally ask for it (occasional requests don’t justify new infrastructure). Test rigorously before committing: run pilots with 5-10 customers to understand real economics, fully load costs including support burden and sales complexity, and measure impact on core business (does new stream help or hurt core revenue?). Many businesses discover that 80% of their profit comes from 20% of revenue streams—identify your highest-return model and go deep rather than diversifying prematurely. In evaluating profitability and valuation, deducting interest from earnings helps you assess core operational performance and is essential for calculating valuation multiples like EBITDA. When considering new initiatives, especially sustainability investments, be sure to measure the financial return to ensure they contribute to cost savings, revenue growth, or risk mitigation. Also, be aware that changes in interest rate and the need for regulatory compliance can impact your financial strategy and operational efficiency.
