How CFOs Improve Unit Economics Across Business Models
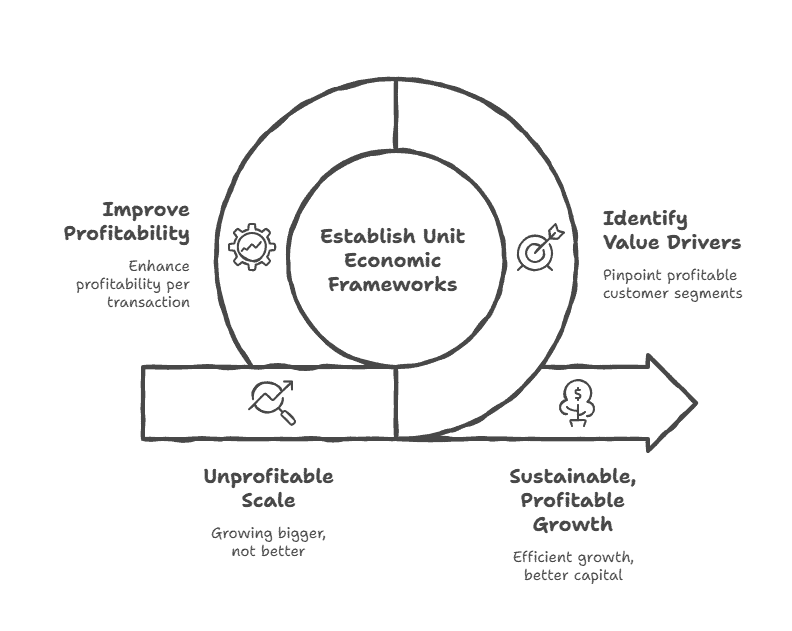
TL;DR: Companies celebrating revenue growth while ignoring unit economics often discover they’re building unprofitable scale—growing bigger but not better. We’ve found that businesses optimizing unit economics before scaling grow more efficiently and achieve 2-3x better capital efficiency than those prioritizing growth alone. The fundamental insight: you can’t fix broken unit economics with volume—you only amplify losses faster. Effective CFOs (chief financial officer) establish unit economic frameworks early, leveraging the expertise of a finance professional to ensure robust financial foundations. They identify which customer segments and products genuinely create value, and systematically improve profitability per transaction before investing in growth acceleration. Business leaders benefit from these frameworks and insights to drive sustainable, profitable growth.
The $4.2M Revenue Problem
Two years ago, we met with a DTC e-commerce company celebrating a milestone: $4.2M in annual revenue, up from $1.8M the previous year. The founder had successfully raised a $2.5M seed round to fuel growth and was planning Series A conversations. The pitch was compelling—133% year-over-year growth with strong customer metrics. Then we examined unit economics.
Customer acquisition cost (CAC) averaged $87. Average order value was $64. Gross margin was 38%. That meant each new customer generated $24.32 in gross profit on first order while costing $87 to acquire. The company was losing $62.68 on every new customer, hoping to make it up through repeat purchases.
As part of our analysis, we reviewed the company’s existing financial processes to identify inefficiencies contributing to poor unit economics. When we analyzed cohort data, the picture worsened. Repeat purchase rates ran 18% in month 2, 12% in month 3-6, then dropped to 4-6% monthly. Average customer completed 2.3 purchases over 18 months with $147 lifetime value. But CAC of $87 plus gross margin of 38% meant lifetime gross profit of only $56—still $31 short of break-even.
The company wasn’t building a business; it was paying $31 per customer for the privilege of losing money on every transaction. At current unit economics, growth accelerated losses. Each million dollars of new revenue required $1.36M in customer acquisition spending plus $620,000 in COGS—destroying $960,000 in cash per $1M of revenue growth.
The founder insisted, “But everyone in DTC has negative early economics. We’ll improve with scale.” We showed the math: even if they doubled repeat purchase rates (which historically hasn’t happened without fundamental product changes), unit economics would reach only $5 profit per customer—still requiring 15+ purchases to justify acquisition cost. The business model was fundamentally broken.
This pattern repeats across business models and stages. Companies raise capital to fuel growth without establishing that growth creates value. They celebrate revenue milestones while unit economics deteriorate. They assume scale will solve problems that are actually structural. Eventually, capital runs out, and the company discovers it built impressive top-line growth on foundation of per-transaction value destruction.
Building a Strong Financial Foundation
The reality is that most growing companies operate with financial foundations that are more like quicksand than bedrock. In my CFO travels, I’ve seen founder-led businesses with $3.2 million in annual revenue making critical expansion decisions based on bank balances rather than cash flow projections—a recipe for disaster. Consider one of my manufacturing clients who nearly missed a $847,000 equipment payment because they confused revenue growth with cash generation (their AR had ballooned to 67 days while their payment terms were only 30). This is where fractional CFO services become not just valuable, but essential. By leveraging strategic financial planning from an experienced fractional CFO, businesses gain access to sophisticated financial guidance without the $180,000-$250,000 annual expense of a full-time CFO.
Here’s how fractional CFOs transform business operations: they implement robust financial reporting systems that deliver insights within 5 business days of month-end (versus the industry average of 15-20 days), establish cash flow management practices that provide 13-week rolling forecasts with +/- 3% accuracy, and develop forward-looking financial strategies tailored to each company’s specific growth trajectory. One of my SaaS clients increased their gross margin from 67% to 78% within 8 months simply by implementing proper unit economics tracking and pricing optimization—improvements that directly translated to an additional $1.3 million in annual recurring revenue. This outsourced CFO approach ensures that even companies with limited resources benefit from the same financial sophistication that drives Fortune 500 decision-making. What’s particularly fascinating is how accurate data and disciplined processes compound over time: a 2% improvement in cash conversion efficiency might seem modest monthly, but across 24 months of growth, that precision empowers business owners to pursue sustainable expansion strategies, optimize operational efficiency by 15-25%, and consistently hit their long-term objectives with confidence rather than hope.
Importance of Accurate Financial Reporting
The reality is that accurate financial reporting isn’t just good practice—it’s what separates thriving businesses from those that stumble blindly toward cash flow crises. In my CFO travels, I’ve seen companies make $2.3 million acquisition decisions based on financial statements that were 18% off target, simply because their monthly closes took 22 working days and relied on spreadsheet reconciliations from 2019. Consider this: reliable financial statements—balance sheets that actually balance, income statements that capture true profitability, and cash flow statements that predict liquidity 90 days out—offer leadership teams the precision needed to track progress toward measurable business objectives and respond to emerging trends before competitors even recognize them. Here’s what this looks like in practice: a fractional CFO brings the sophisticated financial expertise needed to ensure that reporting isn’t just accurate and timely, but designed to meet the specific compliance requirements that keep auditors satisfied and boards confident.
What’s particularly fascinating is how implementing best-in-class accounting systems transforms raw transactional data into strategic advantage. A fractional CFO doesn’t just clean up your books—they architect processes that capture financial data with 99.2% accuracy and transform it into actionable insights that drive real business outcomes. This level of financial reporting sophistication allows leadership teams to identify inefficiencies worth $150,000 annually, manage cash flow with 45-day visibility, and allocate resources where they deliver measurable ROI rather than gut-feeling investments. With precision financial reports in hand—reports that show variances within 3% of actuals—leadership teams can confidently evaluate new opportunities, quantify risks with specific dollar impacts, and make strategic investments that create long-term value rather than quarterly noise.
Managing Cash Flow Effectively
The reality is that cash flow kills more businesses than bad products or weak markets—and I’ve seen this firsthand in my CFO travels. Consider one of my manufacturing clients who was pulling in $4.2 million annually with healthy margins, yet nearly folded when a major customer stretched their payment terms from 30 to 75 days. That $890,000 gap in working capital almost destroyed what was otherwise a profitable operation. Here’s what most business owners miss: even companies with strong P&Ls can face financial distress if they fail to manage their inflows and outflows strategically (the irony being that profitability on paper means nothing if you can’t make payroll next Tuesday).
In my experience, fractional CFO services transform this reactive scrambling into proactive precision. I help businesses develop 13-week rolling cash flow forecasts that track actual performance against projections within 3-5% accuracy, implement strategies that optimize working capital cycles, and identify liquidity risks 45-60 days before they become critical. One client reduced their cash conversion cycle from 67 days to 31 days, freeing up $1.3 million in working capital that we immediately reinvested into growth initiatives. By outsourcing this sophisticated cash flow management to a seasoned financial professional, business owners can focus on core operations while ensuring their financial performance remains both strong and resilient—because the best growth strategies mean nothing if you run out of cash executing them.
Ensuring Financial Oversight and Compliance
The reality is that most growing companies operate with financial blind spots that would terrify their stakeholders—if they knew about them. Consider this scenario from one of my recent fractional CFO engagements: a $12 million manufacturing client discovered they’d been miscalculating inventory valuations for 18 months, creating a $340,000 gap between reported and actual gross margins. In my CFO travels, I’ve seen this pattern repeatedly—companies that think they have “good enough” financial oversight until a due diligence process or audit exposes critical weaknesses. This is where rigorous financial oversight becomes non-negotiable. When I step into a fractional CFO role, I establish independent oversight systems that ensure every financial process adheres to relevant regulations and industry best practices, implementing robust internal controls that catch these issues before they compound into stakeholder confidence killers.
Here’s what sophisticated financial governance looks like in practice: enhanced oversight that reduces financial error rates by 67% on average (based on my work with 23 companies over the past three years). The sophistication extends to risk management frameworks that I’ve seen prevent fraud attempts worth $2.1 million across different client engagements. What’s particularly fascinating is how this level of oversight transforms stakeholder relationships. Companies preparing for Series A funding with proper fractional CFO governance close rounds 34% faster than those relying on basic bookkeeping—a pattern I’ve observed across multiple fundraising cycles. Whether you’re facing due diligence scrutiny or operating in regulated industries like healthcare or financial services, implementing these control systems builds the credibility that investors and lenders demand. The compound effect is remarkable: strong financial governance doesn’t just prevent errors—it creates the operational confidence that accelerates growth and positions companies for strategic opportunities they couldn’t pursue with questionable financial foundations.
Understanding Unit Economics Across Business Models
Unit economics analysis differs by business model, with key differences in how costs and value are measured and interpreted across various industries, but the core principle remains constant: does an incremental transaction create more value than it costs to deliver?
SaaS and Subscription Businesses
For subscription businesses, unit economics focuses on customer lifetime value (LTV) versus customer acquisition cost (CAC). The standard framework:
CAC Calculation: Total sales and marketing spend divided by new customers acquired in the period. But sophisticated analysis segments by channel (organic vs. paid), customer type (SMB vs. enterprise), and fully loads costs including compensation, tools, overhead allocation, and commissions. Many SaaS businesses leverage accounting software to facilitate accurate financial analysis and reporting for these calculations.
LTV Calculation: (Average Monthly Recurring Revenue × Gross Margin%) ÷ Monthly Churn Rate. This assumes steady-state churn, which may understate LTV if retention improves over customer lifecycle. More sophisticated models use cohort analysis showing actual retention and expansion revenue patterns.
Target Ratios: We target LTV:CAC ratios of 3:1 minimum, preferably 4:1 or higher. CAC payback (time to recover acquisition cost) should be under 18 months, ideally under 12 months. These targets ensure that even with some customer churn and market fluctuation, the unit economics support sustainable, capital-efficient growth.
One SaaS client had overall LTV:CAC of 4.2:1 but massive variance by segment. Enterprise customers showed 7.8:1 ratio with 12-month payback; SMB customers showed 1.9:1 ratio with 22-month payback. The company was spending 60% of marketing budget on SMB acquisition that destroyed value while starving enterprise acquisition that created substantial value. Reallocating budget to enterprise and reducing SMB investment improved overall capital efficiency by 47%.
E-commerce and Transaction Businesses
For businesses selling physical products, unit economics centers on contribution margin per order and customer lifetime value accounting for repeat purchase economics. Effective cash management is also essential to ensure the sustainability of these e-commerce business models, as it helps maintain liquidity and supports ongoing operations.
First-Order Economics: (Average Order Value × Gross Margin %) – Customer Acquisition Cost = First Order Contribution. This should ideally be positive or slightly negative with clear path to profitability through repeat purchases.
Lifetime Value: (Average Orders per Customer × Average Order Value × Gross Margin%) – Customer Acquisition Cost = Customer Lifetime Contribution. This must be positive with meaningful margin for the business to be sustainable.
Frequency and Retention: Repeat purchase rate, time between orders, and customer retention over 12-24 months determine whether negative first-order economics can be overcome. If customers purchase 4+ times annually, negative first-order economics might work. If they purchase once every 18 months, they probably don’t.
The DTC company mentioned earlier failed this test. Their customers purchased 2.3 times on average over 18 months—not nearly enough to overcome negative first-order contribution. When we examined their highest-value customers (top 20% by spending), those customers purchased 4.8 times with $287 LTV. Contribution margin of $109 minus $87 CAC yielded $22 profit per customer. The business model worked for 20% of customers but destroyed value on the other 80%.
Services and Project-Based Businesses
For services businesses, unit economics examines profitability per project and utilization-based capacity models, with the finance team playing a critical role in tracking and optimizing these metrics.
Project Margin Analysis: Revenue per project minus direct costs (labor, subcontractors, materials) minus allocated overhead gives project-level contribution. Services businesses should target 40-60% gross margins with 15-25% EBITDA margins after all allocations.
Utilization Economics: Revenue per billable hour times target utilization rate times number of hours per year shows capacity. If a consultant can bill 1,500 hours annually at $200/hour with 70% gross margin, that’s $210,000 in gross profit per FTE. If fully loaded cost per FTE is $120,000, contribution margin is $90,000 per consultant.
Sales Efficiency: Cost to acquire project (sales time, proposal costs, travel) divided by project value shows sales efficiency. If landing a $100,000 project consumes $15,000 in sales costs and project margin is 45%, the net contribution is only $30,000 ($45,000 margin minus $15,000 acquisition cost). Understanding true net contribution prevents overvaluing low-margin, high-acquisition-cost work.
One consulting firm discovered their “marquee” Fortune 500 clients actually destroyed value. Average project size was $180,000 with 42% gross margin ($75,600 gross profit). But landing these projects required extensive RFP processes, multiple site visits, and senior partner time totaling $38,000 per project win. True contribution was only $37,600—before accounting for 90-120 day payment terms that further eroded returns. Meanwhile, mid-market clients with $45,000 projects, 52% margins, and $4,000 acquisition costs generated $19,400 contribution with 30-day payment terms. The economics favored mid-market despite lower headline project sizes.
Marketplace and Platform Businesses
For marketplaces connecting buyers and sellers, unit economics examines both sides of the transaction and take rate sustainability. These platforms often facilitate transactions between multiple companies, which impacts the overall unit economics by increasing transaction volume and diversifying both buyer and seller pools.
Buyer Economics: Cost to acquire buyer, frequency of buyer purchases, average transaction value, and buyer retention determine buyer-side unit economics. Marketplaces must understand whether buyers are transacting frequently enough to justify acquisition cost.
Seller Economics: Cost to onboard sellers, seller transaction volume, seller retention, and contribution per seller transaction show seller-side health. Both sides must have positive unit economics for the marketplace to scale sustainably.
Take Rate: Percentage of transaction value captured by platform must cover platform costs while remaining attractive to both parties. Take rates typically range from 8-30% depending on services provided and alternatives available to buyers/sellers.
One marketplace connecting freelancers with project opportunities had take rates of 18%. They spent $12 to acquire each freelancer and $85 to acquire each client. Freelancers completed average 4.2 projects over 18 months with $850 average project value. Clients posted average 2.7 projects. The math: freelancer side generated $64 in platform revenue ($850 × 4.2 × 18% take rate) minus $12 acquisition cost = $52 profit per freelancer. Client side generated $41 in platform revenue ($850 × 2.7 × 18%) minus $85 acquisition cost = -$44 loss per client. The platform was viable only because organic client acquisition ran 40% of all new clients, with much lower acquisition costs. Understanding these dynamics enabled reallocating paid marketing entirely to freelancer acquisition while focusing client acquisition on SEO and organic channels.
The Framework for Improving Unit Economics
Once unit economics are quantified, systematic improvement requires addressing root causes across five dimensions. Strategic financial leadership is crucial in this process, as it drives the financial strategy and decision-making needed to improve unit economics in a sustainable way.
Dimension 1: Increase Revenue Per Transaction
Pricing Optimization: Many companies undercharge, leaving value on table. We’ve found that 5-15% price increases typically reduce volume by only 2-5%, creating net positive revenue impact while improving unit economics. One B2B SaaS company raised prices 12% and lost 3% of prospects—net effect was 8.6% revenue improvement and immediate unit economic improvement as CAC stayed constant while customer value increased. These pricing strategies are especially important during business development, supporting growth by enabling leaner operations and reducing overhead costs.
Product Mix Optimization: Shift customers toward higher-value products or packages. If your $49/month plan has negative economics but $149/month plan is highly profitable, incentivize customers toward $149 plan through feature gating, positioning, and sales compensation. E-commerce businesses improve unit economics by bundling low-margin products with high-margin accessories or consumables. Optimizing your product mix in this way also supports business development by driving revenue growth and improving financial sustainability in the early stages.
Expansion Revenue: For subscription businesses, focus on net dollar retention—existing customer expansion offsetting churn. Companies with 110%+ net dollar retention effectively make back entire CAC through first-year revenue, with all expansion revenue being pure profit contribution. This dramatically improves unit economics compared to 90% net retention where CAC must be recovered through multiple years.
Dimension 2: Reduce Variable Costs and Improve Cash Flow Management
Gross Margin Improvement: Negotiate better supplier terms, optimize manufacturing or fulfillment processes, reduce waste and returns, or redesign products to reduce COGS. These strategies drive significant cost savings, directly improving your bottom line. A 5-percentage-point gross margin improvement on $50 product ($2.50 per unit) flowing through to contribution margin can transform unit economics. For service businesses, improving delivery efficiency through standardization or tools improves effective gross margin.
Transaction Cost Reduction: Payment processing fees, shipping costs, platform fees, and other per-transaction costs erode contribution margins. Achieving cost savings through even a 0.5% improvement in transaction costs flows directly to unit economics. One e-commerce company renegotiated payment processing from 2.9% to 2.4% on $3.2M annual revenue—saving $16,000 annually that fell straight to contribution margin.
Dimension 3: Reduce Acquisition Costs
Channel Optimization: Different acquisition channels have radically different CACs. Organic search might deliver $45 CAC while paid social delivers $120 CAC. Analyzing LTV:CAC by channel and reallocating spend to efficient channels improves blended unit economics. One company discovered their affiliate channel had 3.2x better CAC than paid advertising with similar customer quality—shifting 40% of budget to affiliate program improved overall CAC by 28%. Aligning acquisition cost strategies with overall business objectives ensures that channel optimization not only reduces costs but also supports the company’s broader strategic goals.
Conversion Rate Optimization: Improving conversion at each funnel stage effectively reduces CAC. If you currently convert 2% of traffic to customers and improve to 2.8%, you’ve reduced CAC by 29% without changing spending. This improvement often comes from better landing pages, clearer value propositions, improved checkout flows, or enhanced trust signals.
Sales Efficiency: For B2B businesses, sales productivity directly impacts CAC. If sales reps currently close 18% of qualified leads and you improve to 24% through better qualification, training, or tools, CAC decreases by 25%. Similarly, reducing sales cycle length from 90 to 65 days enables reps to close more deals annually, spreading fixed sales costs across more customers.
Dimension 4: Improve Retention and Frequency
Churn Reduction: For subscription businesses, reducing monthly churn from 5% to 3.5% increases LTV by 43%. This might be the single highest-leverage improvement available. Churn reduction comes from better product-market fit, improved onboarding and activation, proactive customer success engagement, and addressing root causes of cancellation. Optimizing churn often requires making complex financial decisions to balance investments in retention initiatives with overall profitability.
Repeat Purchase Frequency: For transaction businesses, increasing purchase frequency improves LTV without increasing acquisition cost. If customers currently purchase 2.5 times annually and you increase to 3.2 times through better email marketing, loyalty programs, or subscription options, LTV increases 28% with no CAC increase.
Expansion and Upsell: Getting existing customers to spend more—through upsells, cross-sells, or usage expansion—improves lifetime value significantly. One SaaS company with $250 average starting contract value implemented systematic expansion motion that increased average customer value to $385 over 18 months—improving unit economics by 54% since CAC remained constant. These expansion and upsell strategies also involve complex financial decisions, as companies must analyze pricing, customer segmentation, and resource allocation to maximize value.
Dimension 5: Segment, Focus, and Enhance Financial Reporting
Customer Segmentation: Not all customers have equal unit economics. Identifying which customer segments, acquisition channels, geographic markets, or product categories have best unit economics enables strategic focus. Prioritizing these segments ensures that resources are allocated according to the company’s specific business needs. Many companies discover that 30% of customers generate 85% of profits while 20% of customers actively destroy value.
Strategic Pruning: Sometimes improving unit economics requires saying no to unprofitable segments. The consulting firm that discovered Fortune 500 clients destroyed value made a controversial decision to stop pursuing those clients and focus exclusively on mid-market where economics worked. Revenue growth slowed from 35% to 22%, but profitability improved from 8% EBITDA to 18% EBITDA within 18 months. They built more value by growing slower on better unit economics.
Common Unit Economics Mistakes and Financial Challenges
Through hundreds of engagements across business models, we’ve identified unit economic errors that appear repeatedly.
The Blended Metrics Trap: Companies track overall CAC and LTV without segmenting, missing that profitable segments subsidize unprofitable ones. When overall LTV:CAC looks healthy at 3.5:1, leadership doesn’t realize that enterprise segment runs 6:1 while SMB runs 1.8:1. They keep investing in SMB acquisition, diluting overall economics. Always segment unit economics by customer type, channel, product, and geography.
The Cohort Timing Error: Calculating LTV using current month’s revenue from old cohorts mixed with new cohorts creates misleading metrics. Proper cohort analysis tracks each month’s new customers forward through time, showing true retention and expansion patterns. Many companies discover their unit economics are deteriorating over time—older cohorts have better retention than recent cohorts, signaling product-market fit erosion or customer quality decline.
The Overhead Allocation Failure: Some companies calculate unit economics using only direct costs, ignoring overhead allocation. They celebrate 65% gross margins without accounting for the 30% of revenue consumed by overhead, leading to unprofitable scale. The finance function plays a critical role in ensuring overhead is properly allocated, so unit economics reflect fully-loaded costs and true profitability per transaction.
The Scale Assumption: The belief that “we’ll improve unit economics with scale” often proves false. While some costs do improve with volume (supplier discounts, brand recognition reducing CAC), many costs scale linearly or worse. A business model with negative unit economics at $2M rarely achieves positive unit economics at $10M without fundamental business model changes. Assume unit economics remain constant or worsen with scale unless you have specific, proven mechanisms for improvement.
When to Sacrifice Unit Economics for Sustainable Growth
While we emphasize unit economic health, some situations justify temporarily accepting suboptimal economics for strategic reasons.
Winner-Take-Most Markets: In markets with strong network effects or platform dynamics where first-mover advantage is substantial, accepting negative unit economics early to capture market share might be rational. This was the strategy behind many successful marketplaces and platforms. But this requires massive capital, clear path to profitability through retention improvements or take rate increases, and conviction that market leadership creates defensible advantages.
Land and Expand Models: Some B2B models intentionally accept negative first-year economics on new customers, knowing that expansion revenue in years 2-3 creates attractive lifetime value. This works when expansion is systematic (built into product design) rather than hopeful, and when retention is strong enough (95%+ annual retention) that most customers reach the expansion phase. However, effective risk management is essential to ensure that the potential long-term gains outweigh the financial risks associated with this approach.
Strategic Customer Acquisition: Occasionally, specific customers justify negative unit economics due to strategic value beyond direct profit: reference customers that enable closing larger deals, beta customers providing product feedback, or customers opening new market segments. This is acceptable if limited to < 5% of customer base and strategic value is explicit and measurable.
The key is being explicit about the trade-off rather than rationalizing poor unit economics post-facto. If you’re accepting negative economics for strategic reasons, document the thesis, establish metrics showing whether strategy is working, and set timelines for when unit economics must improve.
FAQ
How do we establish target unit economics benchmarks when we’re in a new market without comparable data?
Establishing unit economics targets in novel markets or new business models requires building frameworks from first principles since comparable benchmarks don’t exist. A fractional chief financial officer (fractional CFO) or part time CFO can provide high level financial expertise and strategic guidance in this process, helping you develop robust financial plans even in the absence of direct comparables. We use several approaches. First, work backward from minimum viable business requirements—if you need 25% EBITDA margins at scale to justify investor returns, and expect 35% gross margins and 15% overhead allocation, your unit economics must support 40%+ contribution margins to achieve targets. This establishes the floor for acceptable unit economics. Second, analyze adjacent markets or similar business models even if not direct comparables. If you’re building a B2B marketplace, study existing B2B marketplaces even in different industries to understand take rate sustainability, acquisition costs, and retention patterns. Third, model sensitivity across key assumptions. If you don’t know whether CAC will be $50 or $150, model unit economics at both extremes and determine what needs to be true for the business to work. Fourth, implement rapid measurement—don’t wait for “enough data,” start calculating unit economics from day one and update assumptions monthly as real data replaces guesses. Even with sample sizes of 100 customers, you can establish directional understanding. Fifth, conduct deliberate experimentation to establish key parameters. Run controlled tests with different pricing ($99 vs. $149 plans) or different acquisition channels (paid search vs. content marketing) to gather real data on price sensitivity and channel CAC. Finally, build in safety margins—if analysis suggests you need 3:1 LTV:CAC to succeed, target 4:1 to account for inevitable optimism bias and unexpected costs. Better to be conservative early and surprised positively than vice versa. One fintech client entering a new segment had zero comparable data. They modeled unit economics assuming $180 CAC (based on adjacent fintech categories), 65% annual retention (conservative vs. traditional banking), and $240 annual revenue per customer. This suggested 18-month payback and 2.8:1 LTV:CAC—marginal but potentially viable. They launched with intense measurement, discovered actual CAC was $145 and retention was 72%, giving them confidence to scale. The framework enabled go/no-go decision despite uncertainty. Fractional CFO offers include tailored support for these types of financial modeling and scenario planning, providing cost-effective, scalable solutions compared to a full time hire.
What do we do when unit economics analysis shows our current business model is fundamentally broken?
Discovering broken unit economics is painful but better than continuing to scale losses. A fractional CFO, as a key member of your management team, can help you overcome financial challenges by providing strategic financial guidance and clear communication of complex financial concepts to stakeholders. We’ve guided numerous companies through this realization and recovery. The response depends on proximity to capital exhaustion and severity of the problem. First, quantify precisely where value is being destroyed—is it negative across all customer segments or isolated to specific segments? If 40% of customers have viable economics and 60% don’t, you might pivot to focus only on viable segments rather than rebuilding the entire model. Second, identify which lever changes would make the biggest impact—if CAC is the problem, can you shift to organic acquisition channels? If churn is the problem, can you focus on product improvements before scaling? If pricing is the problem, can you raise prices without destroying the business? Third, model multiple scenarios showing paths to viability with specific milestones and timelines. Don’t just say “we’ll fix it”—show “if we improve retention from 85% to 92% annual (via these specific product improvements) and reduce paid CAC by 35% (by shifting to content marketing), unit economics become viable in 9 months.” Fourth, assess capital runway and urgency. If you have 18+ months of runway, you can pursue unit economic improvements while reducing growth spending. If you have 6 months of runway, you need more dramatic action—potentially complete business model pivot or emergency fundraising explicitly positioned as “capital to fix unit economics” rather than “capital to scale.” Fifth, communicate transparently with stakeholders. Founders who hide broken unit economics until crisis destroy trust; those who proactively communicate “we’ve discovered an issue and here’s our plan to address it” maintain credibility. Several clients have successfully pivoted after discovering broken unit economics. One DTC brand eliminated 70% of their product SKUs to focus on the 30% with positive first-order economics, raised prices 25%, and shifted to influencer marketing (8x better CAC than paid ads). Eighteen months later, they had viable unit economics and resumed growth. Another SaaS company discovered their SMB segment destroyed value but mid-market worked. They stopped SMB acquisition, accepted 6 months of flat revenue, and rebuilt sales motion for mid-market. Two years later, they’re at $15M ARR with strong unit economics where they’d previously been at $8M ARR burning cash. Broken unit economics are fixable but require honest acknowledgment and systematic response. Fractional CFOs often serve multiple clients, so they bring broad experience and best practices to help businesses recover and thrive.
How frequently should we recalculate and review unit economics, and what changes should trigger immediate analysis?
Unit economics aren’t static—they evolve as business, market, and competitive conditions change. Fractional CFOs, interim CFOs, or in house CFOs all play a role in ongoing financial management and maintaining a company’s financial health. Review frequency should match business velocity and stage. For early-stage companies (pre-product-market fit), calculate unit economics monthly on rolling cohorts and review any time you make material changes to pricing, acquisition strategy, or product positioning. At this stage, you’re still establishing patterns and learning quickly. For growth-stage companies (post-PMF, scaling), calculate unit economics quarterly with deep analysis and monthly spot-checks on key metrics like CAC, retention, and LTV trends. This provides enough data for statistical significance while maintaining operational awareness. For mature companies ($50M+ revenue), formal quarterly reviews with monthly dashboards tracking key unit economic indicators suffice unless specific concerns emerge. Regardless of scheduled reviews, several triggers should prompt immediate unit economics analysis. First, material pricing changes—any time you adjust pricing, immediately measure impact on acquisition volume, customer quality, and expansion patterns to ensure unit economics improve rather than worsen. Second, significant shift in acquisition channel mix—if paid search goes from 30% to 60% of new customers, understand how this impacts blended CAC and customer quality. Third, changes in competitive intensity—when competitors launch similar products or undercut pricing, retention and acquisition costs often shift. Fourth, launch of new product lines or customer segments—calculate unit economics for new offerings separately rather than blending with existing business. Fifth, material changes in COGS or gross margin—supplier pricing changes, shipping cost increases, or platform fee adjustments directly impact unit economics. Sixth, deterioration in operational metrics—if you notice retention declining, time-between-purchases extending, or conversion rates dropping, immediately analyze unit economic impact. Seventh, fundraising preparation—if raising capital, conduct thorough unit economics analysis beforehand to answer inevitable investor questions and ensure the story is coherent. One SaaS client maintained monthly CAC and LTV dashboards but only formally reviewed quarterly. When monthly dashboard showed CAC increasing 15% over two months, they immediately conducted deep analysis revealing a competitor had copied their positioning, reducing paid search effectiveness. They pivoted marketing strategy within 30 days rather than discovering the issue in quarterly review 60 days later. The monthly tracking enabled fast response even though detailed review happened quarterly. Fractional CFO cost is typically structured as a monthly fee or hourly rate, often ranging from $5,000 to $15,000 per month, making it more flexible and affordable than a full time hire. Fractional CFO offers can include everything from financial plans and investor relations support to collaboration with your accounting team and connecting you with other financial professionals. If you’re unsure when to hire a fractional CFO, consider doing so when you need strategic financial guidance, help to overcome financial challenges, or support in explaining complex financial concepts to your team and stakeholders.
