Building a SaaS Headcount Planning Model
Headcount planning models connect hiring plans to revenue growth, burn rate, and cash runway. We build models that start with revenue targets, work backward to determine required capacity, then translate capacity into headcount by role with realistic ramp times and productivity curves. Business leaders, executive leadership, and department heads play a crucial role in collaborating with HR and finance to ensure the headcount planning model aligns with strategic objectives and supports overall business goals.
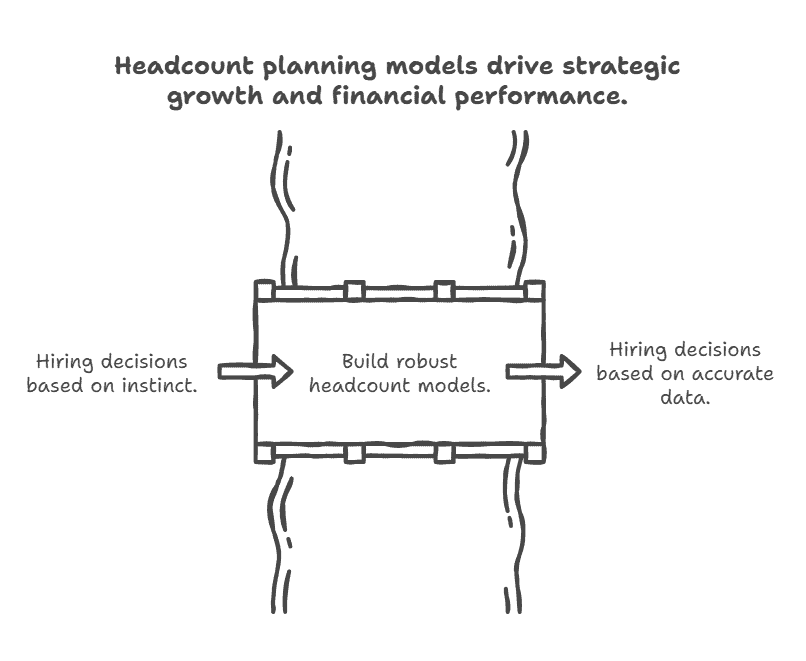
The key is modeling headcount as a driver of outcomes (revenue, product development, customer success) rather than treating hiring as a discretionary expense. Using accurate headcount data and current workforce data as the foundation ensures the model reflects real organizational needs and enables effective, data-driven decision-making. Companies with robust headcount models can forecast financial performance 12-18 months forward and make hiring decisions based on data rather than instinct.
Introduction to Headcount Planning
Headcount planning is a strategic process that ensures your organization’s workforce is perfectly aligned with its business objectives. At its core, effective headcount planning means having the right people, with the right skills, in the right roles—exactly when you need them. For SaaS and high-growth companies, where labor costs are often the largest expense, a robust headcount planning process is essential for managing costs, supporting business growth, and achieving long-term business success.
By treating headcount planning as more than just a hiring exercise, organizations can proactively manage resource allocation, anticipate future needs, and avoid costly missteps like overstaffing or talent shortages. This strategic process connects workforce planning directly to business objectives, enabling leaders to make informed decisions about when to hire, promote, or redeploy talent. Ultimately, a well-executed headcount planning process drives productivity, optimizes labor costs, and positions your company for scalable growth.
In the broader context of workforce planning, headcount planning serves as the bridge between your business strategy and your people strategy. It provides the structure and discipline needed to translate growth plans into actionable hiring roadmaps, ensuring your workforce evolves in lockstep with your business goals.
Why Headcount Planning Matters More in SaaS
People costs typically represent 60-75% of expenses for SaaS companies. Workforce costs are a critical component of strategic workforce planning, directly impacting SaaS business sustainability. Get headcount planning wrong and you’re either understaffed (missing revenue targets) or overstaffed (burning cash unnecessarily). Both kill companies.
We see three common headcount planning failures:
Failure 1: Companies hire reactively based on pain points rather than proactively based on forward-looking needs. They’re already behind on customer support, so they panic-hire three support reps. By the time those reps are productive, the problem has either resolved itself or gotten worse.
Failure 2: Companies build “bottom-up” headcount plans where every department submits wish lists without tying headcount to revenue or capacity requirements. Engineering wants 10 developers, sales wants 8 reps, and marketing wants 6 people—total cost $3M annually. No one asks whether the company can afford $3M or whether those hires will generate sufficient revenue.
Failure 3: Companies model headcount as if new hires are immediately productive at full compensation. They budget for a sales rep starting January 1 at $150K OTE and expect that rep to produce $500K in bookings in Q1. In reality, the rep doesn’t start until January 15, takes 60 days to ramp, and produces $80K in Q1 bookings, not $125K.
Proper headcount planning connects hiring to business outcomes through capacity-based modeling. We start with targets (revenue, product development milestones, customer support requirements), calculate required capacity, translate capacity into headcount, and model realistic ramp and productivity assumptions. Effective workforce management and a clear workforce strategy are essential to avoid these common headcount planning failures and ensure alignment with overall business objectives.
The Strategic Workforce Planning and Headcount Planning Framework
We use a five-step framework for headcount planning as part of a broader workforce planning process. This approach is central to strategic workforce planning, ensuring that staffing and talent management are aligned with your organization’s long-term goals.
Step 1: Define business targets for the planning periodStep 2: Calculate required capacity to achieve targetsStep 3: Model current capacity and productivityStep 4: Determine headcount needs based on capacity gapsStep 5: Build financial model with realistic ramp and productivity curves
Let’s walk through each step.
Step 1: Define Business Targets
Start with clear, measurable targets:
Revenue targets: We need to grow from $5M to $8M ARR (60% growth) over the next 12 months.
Product targets: We need to ship features A, B, and C in Q1, D and E in Q2, F in Q3, and G and H in Q4.
Customer success targets: We need to maintain monthly churn below 2% while scaling from 150 to 250 customers.
Support targets: We need to maintain 12-hour first response time and 95% CSAT while handling 30% more ticket volume.
These targets should be directly linked to the company’s strategic objectives to ensure alignment across the organization.
These targets create the foundation for capacity planning. Don’t move to step 2 until these are clear and agreed upon by leadership.
Step 2: Calculate Required Capacity for Future Workforce
Now translate targets into capacity requirements. Projecting future staffing is a key part of this step, as it ensures your team will be ready to meet business goals as you grow.
Sales capacity: To grow from $5M to $8M ARR (adding $3M net new ARR), we need to consider churn. If we have 15% annual logo churn, we’ll lose $750K ARR, meaning we need $3.75M in new bookings to achieve $3M net growth.
If average rep productivity is $500K annual bookings after full ramp, we need 7.5 fully-productive rep-years of capacity ($3.75M / $500K). But reps aren’t productive all year—they need onboarding time, and new reps aren’t immediately at full productivity.
Model this precisely: If we start the year with 5 reps at full productivity, they’ll generate $2.5M in bookings. We need $1.25M more, requiring 2.5 additional fully-productive rep-years. If new reps take 4 months to ramp to full productivity, we need to hire them in Q1 to ensure they’re productive for the second half of the year. When planning when to hire new reps or managers, consider your future hiring needs and establish clear hiring timelines to ensure capacity is met on schedule.
Engineering capacity: Feature set A-H requires estimation of development effort. If total estimated effort is 18 months of senior developer time, 24 months of mid-level developer time, and 12 months of junior developer time, we need a team that can deliver 54 months of development effort across the year.
If we currently have 2 senior devs, 3 mid-level devs, and 1 junior dev, that’s 72 months of capacity if everyone works full-time on feature development. But that’s not realistic—developers spend time on bugs, technical debt, code review, and meetings. If effective feature development time is 60% of total time, we have 43.2 months of feature capacity, falling 10.8 months short.
This gap requires hiring or descoping features.
Customer Success capacity: If we’re scaling from 150 to 250 customers and each CS manager can effectively support 75 customers, we need 3.3 CS managers at year-end. We currently have 2 CS managers covering 75 customers each (150 total). We need to hire the third CS manager in Q2 to ensure they’re ramped before we hit 225 customers in Q3.
Support capacity: If ticket volume grows from 400 monthly tickets to 520 monthly tickets (30% increase) and each support rep can handle 100 tickets monthly at quality standards, we need 5.2 support reps. We currently have 4 reps, so we need 2 additional reps (rounding up for coverage). Hire one in Q1 and one in Q3 to smooth capacity additions.
Step 3: Model Current Capacity and Productivity
Before determining new hires, it’s essential to assess your existing workforce to accurately model current capacity and productivity. Understanding the strengths and productivity of your current team ensures your headcount planning model reflects real operational capabilities.
Sales team: Average rep productivity is $500K annually, but that includes fully-ramped reps. New reps in their first year average $250K. If you have 2 reps in year 3+ and 3 reps in their first year, total capacity is $1.75M, not $2.5M.
Engineering team: Senior devs ship 1.5x more features per month than mid-level devs, who ship 2x more than junior devs. Don’t model all developers as equivalent capacity.
Customer Success: Junior CS managers handle 50 customers effectively while senior CS managers handle 100 customers. Mix matters.
We track productivity curves by role and tenure:
Sales Rep Productivity Curve: – Month 1-2: 10% of full productivity (onboarding, training) – Month 3-4: 30% of full productivity (ramping) – Month 5-6: 60% of full productivity – Month 7-9: 80% of full productivity – Month 10-12: 90% of full productivity – Month 13+: 100% of full productivity
These curves vary by company and role. Use your historical data to build custom curves.
Step 4: Determine Headcount Needs
With capacity requirements and productivity curves defined, calculate hiring needs:
Sales: We need 7.5 fully-productive rep-years of capacity. We have 5 fully-productive reps providing 5 rep-years. We need 2.5 additional rep-years, but new reps won’t be fully productive. If we hire 3 reps in Q1, by year-end they’ll be at 90% productivity, providing 2.7 fully-productive rep-years (3 reps × 0.9 productivity). This slightly exceeds our 2.5 requirement, providing buffer for variability.
Engineering: We have a 10.8-month feature capacity shortfall. Hiring 1 senior developer (who provides 1.5x capacity) would add 10.8 months of effective capacity (18 months × 60% utilization × 1.5x multiplier), closing the gap. Alternatively, hire 1 mid-level and 1 junior developer for similar capacity at lower cost.
Customer Success: We need 3.3 CS capacity at year-end. We have 2 CS managers. Hire 1 CS manager in Q2. They’ll ramp over 90 days and be fully productive by Q3, ensuring coverage for growth.
Support: We need 5.2 support reps at year-end. We have 4 reps. Hire 2 additional reps, one in Q1 (ready for Q2 volume) and one in Q3 (ready for Q4 volume).
Total hiring plan: – 3 sales reps (Q1) – 1 senior developer or 2 mid/junior developers (Q1-Q2) – 1 customer success manager (Q2) – 2 support reps (Q1, Q3)
This gives us 7-8 hires across the year, staged to match capacity needs. Identifying and prioritizing critical positions in this plan is essential to ensure organizational continuity and growth.
Step 5: Build Financial Model
Now translate hiring plan into financial projections with realistic timing and ramp assumptions. It’s important to track key metrics throughout the hiring process to ensure your financial model accurately reflects recruitment effectiveness and hiring timelines.
Sales Rep Financial Model:
Hire 3 reps in Q1. Assume $120K base salary + $30K OTE ($150K total comp).
– Q1 cost: 3 reps × $37.5K = $112.5K (hired January 1, only 10-30% productive) – Q1 bookings contribution: 3 reps × $125K quota × 20% average productivity = $75K
– Q2 cost: 3 reps × $37.5K = $112.5K (30-60% productive) – Q2 bookings contribution: 3 reps × $125K × 45% average productivity = $168.75K
– Q3 cost: 3 reps × $37.5K = $112.5K (60-80% productive) – Q3 bookings contribution: 3 reps × $125K × 70% average productivity = $262.5K
– Q4 cost: 3 reps × $37.5K = $112.5K (80-90% productive) – Q4 bookings contribution: 3 reps × $125K × 85% average productivity = $318.75K
Total annual cost: $450K Total annual bookings: $825K First-year ROI: 1.83x (will improve in year 2 as reps reach full productivity)
Integrating human capital management principles into your model—such as aligning workforce data, talent management, and strategic HR planning—can further improve the accuracy and strategic value of your headcount planning.
Model all roles this way, accounting for: – Actual hire dates (not assuming January 1 starts) – Ramp time before productivity – Productivity curves by role – Fully-loaded costs (salary + benefits + taxes + overhead)
Advanced Headcount Forecasting and Modeling Techniques
As you sophisticate your headcount model, add these elements. Remember, headcount planning focuses on immediate staffing needs, roles to fill, and operational decisions, while advanced modeling techniques can help address longer-term talent management and future skills requirements for your organization.
Attrition modeling: Don’t assume 100% retention. If annual attrition is 15%, model that into capacity planning. If you need 20 FTEs at year-end with 15% attrition, you need to hire 23-24 people across the year.
Productivity variation: Not all reps perform equally. Model productivity distribution: 20% of reps exceed quota by 30%, 60% hit quota, 20% underperform by 30%. This creates more realistic bookings forecasts than assuming everyone hits 100% of quota.
Hiring delays: If you plan to hire in Q1, assume 60-90 day recruiting cycles. A Q1 hire might not start until March, shifting all downstream productivity calculations.
Geographic cost variation: If you’re hiring in multiple locations, model different compensation levels. A senior developer in San Francisco costs $200K+ while a senior developer in Austin costs $160K.
Loaded cost multipliers: Don’t just model salary. Include payroll taxes (7.65%), benefits (20-30% of salary), equipment ($3K per employee), software ($2K per employee), and office costs ($15K per employee annually if you have an office). A $120K salary employee costs $165K+ fully loaded.
By integrating these advanced techniques, your headcount planning model can support not only short-term operational needs but also strategic talent management, succession planning, and the identification of future skills gaps critical for long-term business growth.
Common Headcount Planning Mistakes
Mistake 1: Hiring for current pain instead of future needs. By the time you feel the pain, you’re already behind. Hire 3-6 months ahead of when you’ll need capacity.
Mistake 2: Not accounting for ramp time. New hires aren’t productive on day one. Model realistic productivity curves or you’ll miss targets.
Mistake 3: Treating all employees as equal capacity. A 10-year senior engineer is worth 3-4 junior engineers in productivity, but only costs 2x as much. Model individual productivity, not just headcount.
Mistake 4: Building headcount plans without revenue constraints. You can’t hire 50 people if your burn rate only supports 30 people. Headcount must fit within your financial constraints.
Mistake 5: Not stress-testing assumptions. What if sales productivity is 20% lower than modeled? What if attrition is 25% instead of 15%? Build scenarios to understand sensitivity.
Mistake 6: Planning annually without monthly granularity. Annual headcount plans hide timing issues. Model month-by-month to understand cash flow impact and capacity bottlenecks.
Using a free headcount planning template and maintaining accurate headcount data can help organizations avoid these common mistakes by providing structure, improving data accuracy, and supporting better decision-making.
Connecting Headcount Planning to Cash Runway
Headcount planning directly impacts cash runway. If your monthly burn rate is $400K and you have $6M in the bank, you have 15 months of runway. But if your headcount plan adds $200K in monthly expenses by month 6, your new burn rate is $600K, and your runway drops to 12 months effectively.
Model cash runway with headcount changes:
Current state: $6M cash, $400K monthly burn = 15 months runway
After hiring plan:
– Month 1-3: $400K burn – Month 4-6: $450K burn (first hires ramp up) – Month 7-9: $550K burn (all hires at full cost) – Month 10-12: $600K burn (additional mid-year hires)
Actual runway calculation: – Months 1-3: $1.2M spent, $4.8M remaining – Months 4-6: $1.35M spent, $3.45M remaining – Months 7-9: $1.65M spent, $1.8M remaining – Months 10-12: $1.8M spent, $0 remaining
This hiring plan consumes all cash in 12 months, not 15 months, giving you 9-10 months to execute before needing to raise capital.
Always model headcount’s impact on runway and ensure you maintain 6-12 months of cash buffer for fundraising.
Building Headcount Planning Into Your Financial Model
Integrate headcount planning into your three-statement financial model:
Income statement: Headcount drives salary expense, which is typically the largest operating expense line. Model monthly salary expense by department, accounting for new hires, ramp times, and attrition.
Balance sheet: Headcount affects deferred revenue if new hires enable faster product delivery and sales. More support capacity means happier customers means better retention means higher deferred revenue balances.
Cash flow statement: Salary payments are the largest operating cash outflow. Model cash impact of hiring plans to ensure sufficient runway.
The headcount model becomes a driver-based input to the full financial model, creating dynamic forecasts that respond to hiring decisions.
Q: Should we hire ahead of revenue growth or wait until we have the revenue to support new hires?
This depends on your cash position and growth stage. Companies with strong cash positions (18+ months runway) should hire ahead of growth to avoid capacity bottlenecks. Companies with limited cash (6-12 months runway) need to hire more conservatively, matching hiring to confirmed revenue. The worst scenario is hiring aggressively without cash buffer and then missing revenue targets, forcing layoffs 6 months later. A good rule: hire ahead of growth if you have 12+ months runway after accounting for hiring costs. Hire conservatively if runway is under 12 months. For sales roles specifically, we recommend hiring 2-3 quarters ahead of when you need capacity since reps take 6-9 months to reach full productivity.
Q: How do we account for hiring failures and wrong hires in headcount planning?
Build a 10-15% “hiring miss rate” into your model. If you plan to hire 20 people, assume 2-3 will either not work out or leave within the first year. This affects capacity planning—if you need 20 FTEs at year-end, plan to hire 22-23 to account for misses. Also model longer time-to-fill than you expect. If you think you can fill a role in 60 days, assume 90 days in your model. Most companies underestimate both how long hiring takes and how often hires don’t work out. Better to be pleasantly surprised than caught short on capacity.
Q: Should headcount planning be driven by department requests or by company-level capacity needs?
Company-level capacity needs should drive the plan, with department input on execution. Here’s why: every department will request more headcount than the company can afford or needs. The CFO/finance function should build a capacity-based model showing how much headcount is required to hit company goals, then work with department leaders to refine the plan. Department leaders provide input on role types, productivity assumptions, and organizational structure, but they shouldn’t determine total headcount in isolation. This top-down approach prevents budget bloat while ensuring hiring aligns with company priorities. The exception is critical technical hires where the department leader’s judgment should carry significant weight—CFOs shouldn’t override CTOs on whether they need a senior architect.
Implementing the Headcount Plan
Turning a headcount plan into reality requires more than just a spreadsheet—it demands cross-functional collaboration and disciplined execution. Finance teams, hiring managers, and human resources must work together to ensure the plan supports the organization’s strategic goals while staying within budget constraints and adapting to market trends.
A successful implementation starts with clear alignment on business objectives and hiring priorities. Using a workforce planning template or headcount planning template can help standardize the process, making it easier to track key metrics such as headcount forecasting, budgeting accuracy, and progress against hiring goals. These tools also help identify skill gaps, support succession planning, and facilitate internal mobility, ensuring your workforce is prepared for both current and future needs.
Review and Adjustment
Headcount planning is not a one-and-done exercise—it’s an ongoing process that requires regular review and adjustment to stay aligned with your business objectives and the realities of a changing market. By continuously monitoring key metrics such as hiring progress, labor costs, and employee morale, you can quickly identify areas where your plan may be falling short or where new opportunities have emerged.
Scenario planning is a powerful tool in this phase, allowing you to forecast future workforce needs and test how different business scenarios—like accelerated growth, new product launches, or market downturns—might impact your staffing needs. Maintaining a comprehensive inventory of your current workforce, including existing employees, new hires, and projected future staffing needs, enables you to make informed decisions about resource allocation and optimize your headcount structure.
Regularly updating your headcount planning process with up-to-date workforce data ensures you can respond proactively to changes, minimizing the risk of talent shortages, overstaffing, or misaligned teams. By leveraging analytics and data-driven insights, you can refine your approach, improve budgeting accuracy, and ensure your headcount plan remains a strategic asset for driving business success. This commitment to continuous improvement is what separates effective headcount planning from reactive, ad hoc hiring—and it’s essential for any organization aiming for long-term growth and organizational success.
