BI & Analytics Implementation: Turning Scattered Data Into a Single Source of Truth
in Fractional CFO, Cash Flow Improvement, Fractional CFO, Roles of a Fractional CFO, All Posts
Most growth-stage companies I work with don’t have a data problem; they have a data location problem.
The numbers exist, but they’re scattered across two ERPs, a handful of spreadsheets, a payments processor, and someone’s personal tracking file, and no two people in the company would give you the same answer to “what were we up last month.”
That gap is what business intelligence and analytics implementation is supposed to close, and it’s one of the highest-leverage things a finance function can build.
Plenty of companies license a BI tool, connect a few data sources, and end up with a dashboard nobody trusts because they didn’t reconcile the underlying data first. Real BI implementation starts with the finance function establishing a single source of truth, one set of numbers that every stakeholder, from the founder to the board to a prospective buyer, is working from.
The dashboard is the last step, not the first.
TL;DR
- BI implementation fails when it starts with the tool instead of the data, dashboards built on unreconciled numbers just make bad data look more official.
- The foundation is a single source of truth: consolidated, reconciled data across every system feeding the business, updated on a predictable cadence.
- Core analytics that matter for growth-stage companies include CAC, LTV, churn, rep utilization, and product-level profitability, not just top-line revenue.
- One client automated a two-ERP consolidation using Syft Analytics for $23/month, eliminating three weeks of manual close work every period.
- Getting this right changes what leadership can act on in real time and what a buyer or investor sees when they look under the hood.
Why BI Implementation Starts With Reconciliation, Not Reporting
The instinct when a company decides it wants “better analytics” is to shop for a BI tool; Power BI, Tableau, or a fintech dashboard product, and then start connecting data sources.
That’s getting it backward. If your two ERPs don’t talk to each other, intercompany transactions aren’t eliminated, your chart of accounts is inconsistent across entities, then plugging all of that into a dashboard tool produces a more convincing-looking version of the same wrong numbers.
We saw this directly with a family-owned transportation business running two ERPs with no consolidation history. Just each operating entity closed independently.
No intercompany elimination process existed, and when a banker-led sell-side engagement required clean consolidated financials, they didn’t exist.
The fix wasn’t a dashboard; it was foundational.
We mapped the chart of accounts across both ERPs, built an automated consolidation model with intercompany eliminations and rollforward schedules, and restated two years of consolidated financials. Only once that foundation was in place did we automate the ERP data feeds for ongoing monthly close, eliminating three weeks of manual work every period.
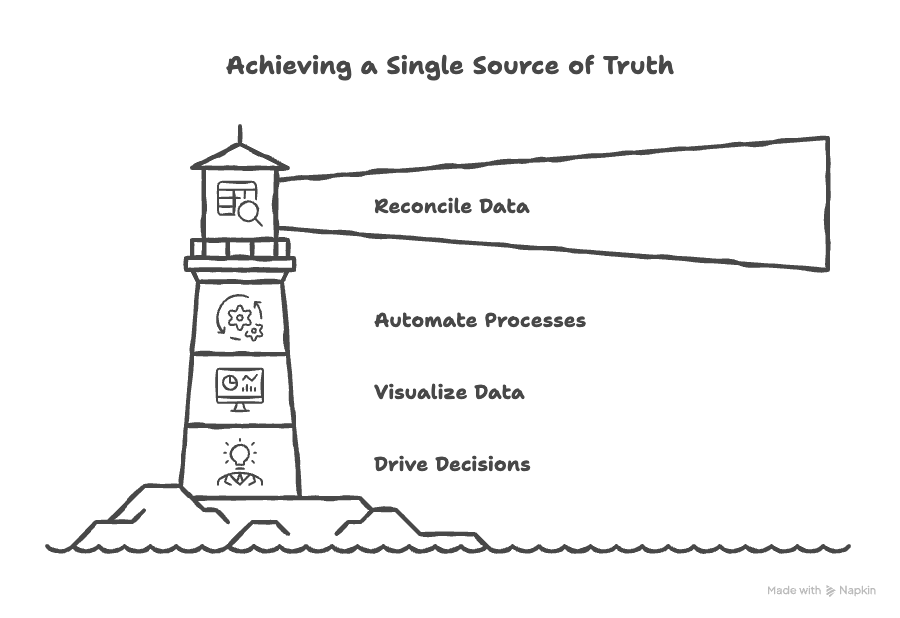
That sequencing; reconcile first, automate second, visualize third, is the difference between a BI implementation that leadership actually trusts and one that gets ignored after the first month.
What “Single Source of Truth” Actually Means
A single source of truth isn’t a slogan; it’s a specific technical outcome.
It means every stakeholder in the business, whether they’re looking at a board deck, a management report, or a live dashboard, is pulling from the same underlying, reconciled dataset. No side spreadsheets with different numbers. No “the sales team’s version” versus “finance’s version” of last month’s revenue.
For a two-entity industrial business we worked with, this meant installing and customizing Syft Analytics, a tool that costs roughly $23 a month, and building a semi-automated monthly consolidation process around it.
The cost of the tool was trivial;however, value was in the process built around it: a repeatable way to combine two separate accounting systems into one coherent financial picture, with overhead properly allocated and intercompany pricing accounted for.
Before that work, no consolidated view existed, which meant no investor, lender, or buyer could get a straight answer about how the business performed as a whole.
The same discipline applies more broadly to ERP integration. When we stepped into a PE-backed sports media company where two ERPs held conflicting data, the fix wasn’t a new tool; it was strategically reorganizing the ERPs and aligning the chart of accounts so the numbers agreed before any dashboard was layered on top.
The Analytics That Actually Drive Decisions
Once the data foundation is solid, the analytics layer should answer the questions that actually change how leadership runs the business, not just report activity for its own sake.
The recurring set we build for clients includes:
CAC and LTV:
What does it actually cost to acquire a customer through each channel, and what is that customer worth over their lifetime? For one CPG client, we built a weekly digital ad spend model tracking customer acquisition cost, return on ad spend, and customer value, turning marketing spend from a guess into a measured input.
Churn:
Especially for subscription and recurring-revenue businesses, churn analysis by cohort tells you whether growth is real or whether you’re refilling a leaking bucket.
Product and customer profitability:
Aggregate revenue numbers hide a lot. Understanding which products, service lines, or customer segments are actually profitable, versus which are subsidized by the rest of the business, routinely changes pricing and resourcing decisions.
Rep and team utilization::
For services and project-based businesses, understanding where time and capacity are actually going is often the single biggest lever on margin.
None of these are exotic:
They’re standard analytics any well-run finance function should produce. The reason most growth-stage companies don’t have them isn’t sophistication; it’s that nobody has built the reconciled data foundation underneath them yet.
What Good BI Implementation Delivers
Done right, BI and analytics implementation changes two things simultaneously. Internally, leadership stops making pricing, staffing, and expansion decisions on gut instinct and starts making them against a model that reflects reality. Externally, when a lender, investor, or buyer asks for KPI dashboards covering the last 24 months, which is a standard data room request, the answer is “here it is,” not “give us six weeks.”
That second point matters more than most founders realize until they’re in the middle of a capital raise or a sale process. A buyer’s diligence team will build their own version of your numbers regardless of what you hand them. The question is whether your numbers and their independently reconstructed numbers agree. When they don’t, it doesn’t matter whether the underlying business is fine, the mismatch itself becomes the red flag, and it costs time, leverage, or both.
Getting Started Without Overbuilding
You don’t need an enterprise data warehouse to get this right.
Most growth-stage companies are well served by a lean stack: clean, reconciled source systems; a lightweight consolidation and automation layer (Syft, or a well-built Excel/Power BI model, depending on complexity); and a small number of dashboards focused on the metrics that drive decisions.
The mistake is building something elaborate before the underlying data is trustworthy. Get the foundation right first, and the dashboard becomes the easy part.
Who Should Own This Work
BI implementation often stalls because it lands on the wrong desk. An IT-led implementation tends to optimize for technical architecture without necessarily knowing which financial metrics actually matter or where the reconciliation gaps are hiding.
A pure operations-led implementation tends to produce dashboards that look right but haven’t been checked against GAAP or against how a lender or investor will read them.
The reason this work sits naturally with a finance function, and specifically with a fractional CFO who’s built this infrastructure before, is that it requires both: enough technical fluency to build the automation, and enough financial rigor to know that the numbers underneath it are actually correct before they get published anywhere.
That combination is also why this work moves faster with outside expertise than as a side project for an already-stretched internal team.
A finance leader who has done this reconciliation-to-dashboard sequence before knows where the landmines typically sit, inconsistent chart of accounts, unreconciled intercompany balances, revenue recognition timing mismatches, and can move through them in weeks instead of the months it often takes an internal team learning the process for the first time.
FAQ
Q1: We already have a BI tool licensed, why isn’t it giving us useful numbers?
Almost always, it’s because the tool is connected to source data that hasn’t been reconciled. If your ERPs, spreadsheets, or entities disagree with each other, the dashboard just displays that disagreement more attractively. Fix the reconciliation first, and most BI tools work fine after that.
Q2: How long does a full BI and analytics implementation typically take?
For a single-entity business with reasonably clean books, a working dashboard suite can be live in 4–8 weeks. Multi-entity consolidations, historical restatements, or ERP realignment add time, we’ve seen full restatement and automation projects take a few months, but the payoff is a close process that runs itself afterward instead of consuming three weeks of manual work every period.
Q3: Do we need to replace our accounting software to do this properly?
Rarely. Most implementations work with your existing ERP and accounting systems. The work is in reconciliation, chart of accounts alignment, and adding a lightweight consolidation or BI layer on top, not ripping out and replacing what you already have.

Salvatore Tirabassi is the Founder of CFOPro+Analytics, providing fractionalCFO services to growth-stage companies. Based in New York, he leverages over 24 years of experience in venture capital and strategic finance to help entrepreneurs master cash flow, unit economics, and equity value creation through data-driven financial clarity.