How to Build a Healthcare Services Forecast (A CFO Framework for Predicting Revenue, Margin, and Cash Flow)
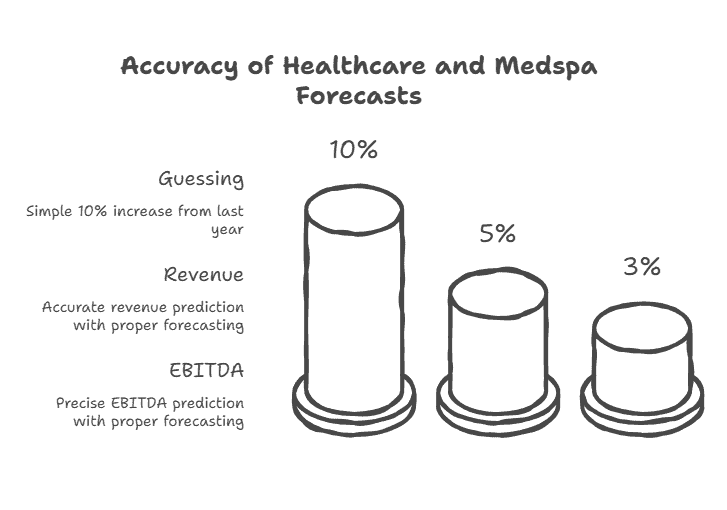
TL;DR: Most healthcare and medspa practices forecast by taking last year’s numbers and adding 10%. That’s not forecasting—it’s guessing. A true service forecast starts with provider capacity, utilization rates, and service mix, then layers in pricing, seasonality, and ramp curves. When built correctly, you can predict revenue within 5% and EBITDA within 3%—turning growth from hope into strategy.
Why Most Healthcare Forecasts Are Worthless
The standard forecasting approach fails because:
1. Top-Down Guessing
– “We did \$2M last year, let’s target \$2.4M”
– No connection to actual capacity
– Assumes linear growth across all services
2. Ignoring Provider Capacity
– Doesn’t account for provider hours, vacations, or ramp time
– Assumes 100% utilization forever
– Can’t answer “Do we need another injector?”
3. No Service Mix Modeling
– Treats all revenue as equal
– Misses margin shifts as service mix changes
– Can’t predict the impact of new service launches
4. Static, Not Dynamic
– Created once a year, then ignored
– No mechanism for monthly updates
– Can’t respond to actual performance vs. plan
A real forecast is a living model that drives weekly decisions.
The 7 Building Blocks of a Healthcare Service Forecast
1. Provider Capacity Model
2. Utilization Assumptions
3. Service Mix Projections
4. Pricing Strategy & Changes
5. New Provider Ramp Curves
6. Seasonality & Demand Patterns
7. Margin & Cash Flow Conversion
Let’s build this step by step.
1. Provider Capacity Model: The Foundation
Start with what’s physically possible:
For each provider:
– Scheduled clinical hours/week
– Weeks worked/year (minus PTO, holidays, CME)
– Clinical vs. non-clinical time split
Example: NP Injector
– 32 clinical hours/week
– 48 weeks/year (4 weeks PTO/holidays)
– Clinical hours/year: 32 × 48 = 1,536 hours
Total Practice Capacity:
Sum all providers’ clinical hours.
This is your absolute maximum revenue potential.
2. Utilization: The Reality Adjustment
No provider is 100% utilized. We apply:
Realistic Utilization Targets:
– New provider (months 1–3): 40–50%
– Ramping provider (months 4–6): 55–65%
– Established provider: 70–85%
– Star performer: 85–90% (max sustainable)
Example with 3 Providers:
1. Established: 1,536 hours × 80% = 1,229 productive hours
2. Ramping: 1,536 × 60% = 922 hours
3. New: 768 hours (6 months) × 45% = 346 hours
Total Forecasted Hours: 2,497
3. Service Mix: What Actually Gets Done
Hours alone don’t equal revenue. We need service mix:
Create a Service Mix Matrix:
| Service | % of Hours | Avg Time | Avg Price | Revenue/Hour |
|——————-|—————-|————–|—————|——————|
| Neurotoxin | 35% | 30 min | \$450 | \$900 |
| Filler | 25% | 45 min | \$650 | \$867 |
| Laser Hair Removal| 20% | 15 min | \$150 | \$600 |
| Facials | 15% | 60 min | \$200 | \$200 |
| Consults | 5% | 60 min | \$0–\$100 | \$0–\$100 |
Weighted Average Revenue/Hour:
(35% × \$900) + (25% × \$867) + (20% × \$600) + (15% × \$200) + (5% × \$50) = \$702/hour
4. Putting It Together: The Revenue Forecast
Quarterly Forecast Example (Q1):
Capacity:
– Provider A: 384 hours × 80% = 307 hours
– Provider B: 384 × 65% = 250 hours
– Provider C: 192 × 50% = 96 hours (new, half quarter)
– Total: 653 hours
Revenue: 653 hours × \$702/hour = \$458,406
Margin: Assume 58% average contribution margin
– Contribution margin: \$458,406 × 58% = \$265,876
– Less fixed overhead: \$180,000
– EBITDA: \$85,876
5. New Provider Ramp Curve: The Growth Engine
Adding providers isn’t linear. Model the ramp:
Typical 12-Month Ramp Curve:
– Month 1–2: 30–40% utilization
– Month 3–4: 40–55%
– Month 5–6: 55–70%
– Month 7–9: 70–80%
– Month 10–12: 80–85%
Cash Impact: New providers cost more (salary) than they generate (revenue) for 4–6 months.
6. Seasonality & Demand Patterns
Healthcare isn’t flat. Build in:
Monthly Adjustment Factors (Example):
– January: 110% (post-holiday surge)
– February: 95%
– March: 100%
– April: 105%
– May: 110%
– June: 120% (summer prep)
– July: 105%
– August: 100%
– September: 110%
– October: 115%
– November: 90% (holiday slowdown)
– December: 70%
7. The Complete Forecasting Workbook
A CFO-grade forecast includes:
Tabs/Sections:
1. Assumptions (rates, utilization, mix)
2. Provider Roster (hours, ramp status)
3. Service Catalog (prices, duration, margin)
4. Monthly Forecast (hours × mix × price)
5. Margin Roll-up (contribution → EBITDA)
6. Cash Flow Projection (AR, prepaids, timing)
7. Scenario Planning (what-if analysis)
8. Actual vs. Forecast (variance tracking)
Case Study: \$4M Medspa Improves Forecast Accuracy
Before:
– Annual “guess-timate”
– Actual vs. forecast variance: 20–30%
– Constant cash surprises
– No visibility into provider productivity
After Implementing Driver-Based Forecast:
– Monthly rolling 12-month forecast
– Updated with actuals each month
– Clear capacity constraints identified
– Service mix optimized based on margin
Results:
– Forecast accuracy: ±5% monthly
– EBITDA predictability: ±3%
– Cash flow visibility: 90 days out
– Ability to time new hires perfectly
Strategic CFO Insights
1. Forecasts should be driver-based, not percentage-based.
2. Capacity × utilization × service mix = predictable revenue.
3. New providers are investments with 4–9 month payback periods.
4. The best forecast is updated monthly, not created annually.
5. Margin forecasting is more important than revenue forecasting.
FAQ
1. How far out should we forecast?
– Operational: 90 days (detailed, by provider)
– Tactical: 12 months (monthly, by service line)
– Strategic: 24–36 months (quarterly, by location)
2. What’s the most common forecasting mistake?
Assuming linear growth without considering capacity constraints.
3. How do we forecast for a new location?
Build from the ground up:
1. Provider hiring plan with ramp curves
2. Conservative utilization assumptions
3. Phased service mix (start simple, expand)
4. 18-month cash flow model to breakeven
