How to Build a Multi-Site Healthcare Budget (A CFO Framework for Scaling With Financial Control)
The result? Leadership is flying blind, unable to compare performance or make data-driven expansion decisions. This guide outlines how to build a unified system that turns fragmented data into a scalable engine for growth.
TL;DR
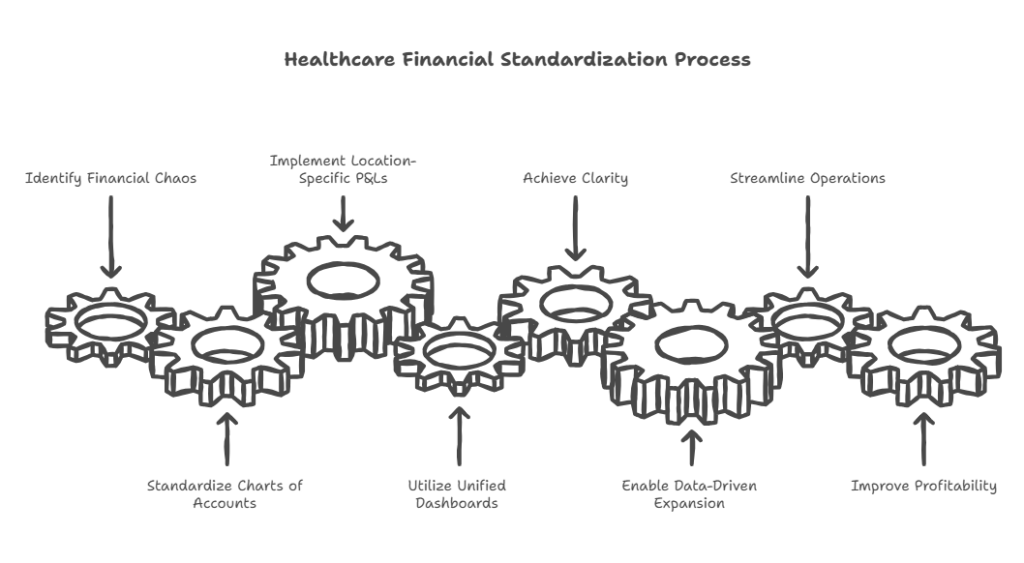
Multi-location healthcare groups often face financial chaos due to inconsistent data and manual reporting. By standardizing charts of accounts, implementing location-specific P&Ls, and utilizing unified dashboards, organizations achieve clarity. This framework enables data-driven expansion, streamlines operations, and improves profitability, transforming fragmented reporting into a scalable engine for growth.
The 5 Fatal Flaws of Multi-Location Financial Reporting
-
Inconsistent Chart of Accounts: Location A calls it “Supplies,” Location B calls it “Consumables.” Without a shared language, consolidation requires days of manual rework.
-
Different Reporting Timelines: Location 1 closes on the 5th; Location 3 closes “when they get to it.” Monthly reporting becomes monthly guessing.
-
No Standardized KPIs: Each manager tracks what they think is important. You can’t identify best practices if you aren’t comparing apples to apples.
-
Manual Spreadsheet Hell: When corporate spends days consolidating Excel “masterpieces,” errors are inevitable and transparency is impossible.
-
Invisible Inter-Company Transactions: Corporate allocations are often misunderstood or resisted. Location managers feel penalized by a “corporate tax” they don’t understand.
The 7 Components of a Unified System
The solution isn’t more reports—it’s better-designed reports.
1. Standardized Chart of Accounts (COA)
Every location must use the same numerical structure. No exceptions.
-
4000s (Revenue): Injectables, Laser, Skincare, Memberships.
-
5000s (COGS): Consumables, Medical Supplies, Retail Cost.
-
6000s (OpEx): Provider Comp, Marketing, Rent, Software.
2. Location-Level P&L: The Manager’s Scorecard
Each site needs a P&L that answers: Is this location fundamentally profitable before corporate interference?
Key Metric: Location EBITDA. This measures the site’s performance against its own local market realities before headquarters’ overhead is applied.
3. Consolidated Group View: The Big Picture
This report answers: “How are we doing as a company?” It rolls up all locations, adds corporate overhead (Executive salaries, HR, Legal), and reveals the Group EBITDA—the number that truly matters for valuation.
4. The KPI Dashboard: Comparing Apples to Apples
Use a standardized dashboard to spot winners and laggards at a glance.
| KPI | Location A | Location B | Location C | Group Avg |
| Revenue | $450,000 | $380,000 | $520,000 | $450,000 |
| Revenue Growth (YoY) | 18% | 12% | 25% | 18% |
| Contribution Margin % | 62% | 58% | 65% | 62% |
| Location EBITDA % | 24% | 19% | 28% | 24% |
| Rebooking Rate | 78% | 72% | 82% | 77% |
5. Inter-Company Allocation Framework
To eliminate resistance, allocate corporate costs transparently:
-
By Headcount: HR and Payroll costs.
-
By Revenue: Corporate marketing and Brand development.
-
By Transaction Volume: Billing and Collections support.
6. Cash Flow Reporting by Location
EBITDA is an opinion; Cash is a fact. Each location must track its own “Net Cash Flow” to identify which sites are funding the group and which are draining it.
7. The Monthly Reporting Rhythm
-
Days 3–5: Finalize location P&Ls and variance analysis.
-
Day 6: Consolidated group report and “Red Flag” identification.
-
Day 7: Location manager review meetings to share best practices.
Implementation Roadmap: 90 Days to Clarity
-
Month 1: Standardization. Create the COA and set a hard closing calendar (e.g., all locations close by business day 3).
-
Month 2: Implementation. Run the first month on the new system. Fix coding inconsistencies.
-
Month 3: Refinement. Add KPI dashboards and the allocation framework. Train managers on variance analysis.
-
Month 4+: Optimization. Integrate predictive modeling to forecast patient volume and staffing needs.
Case Study: From Chaos to 30% Higher Valuation
A 6-location medspa group was struggling with a 15-day close cycle and wild EBITDA swings (8% to 26%).
-
The Move: They standardized the COA and implemented a transparent allocation methodology.
-
The Result: The close cycle dropped to 3 days, and the EBITDA range narrowed to a healthy 19–28%.
-
The Exit: Because the financials were “clean” and scalable, the owners sold the company for a 30% higher multiple than initially projected.
Strategic Insights for the Healthcare CFO
The CFO’s Strategic Role
In a multi-site environment, the CFO isn’t just a bookkeeper—they are the linchpin of growth. They must synthesize data from disparate sites into actionable insights, helping the CEO decide whether to invest in Location A or fix the operations at Location B.
Scalability & Inventory
A scalable framework allows you to plug in “Location #11” without breaking your accounting team. Integrating inventory management is vital here; overstocking at multiple sites is a silent killer of cash flow.
Aligning Control with Reality
No two locations are identical. Your budget models must account for local labor costs and market demand. A “one-size-fits-all” budget is a recipe for frustrated managers and missed targets.
Frequently Asked Questions
Q: Should all locations use the same accounting software? Ideally, yes. However, what matters most is that the output (the data structure) is identical. You can bridge different systems with a unified analytics layer.
Q: How do we handle new vs. mature locations? Use Segment Reporting. Focus on “ramp metrics” (new patient count, utilization) for sites under 12 months, and shift to “profitability targets” for mature sites.
Q: What if a location manager isn’t “numbers-oriented”? Education is part of the process. Spend 20 minutes each month teaching them 3–5 key metrics they can actually control, like rebooking rates or supply waste.
Q: How do analytics tools help with care gaps? By aggregating data, you can see if specific locations are underperforming in patient outcomes or seeing higher denial rates, allowing for targeted operational fixes.
