Multi-Location Financial Reporting for Healthcare Groups (A CFO Framework for Consistent, Actionable Insights Across Sites)
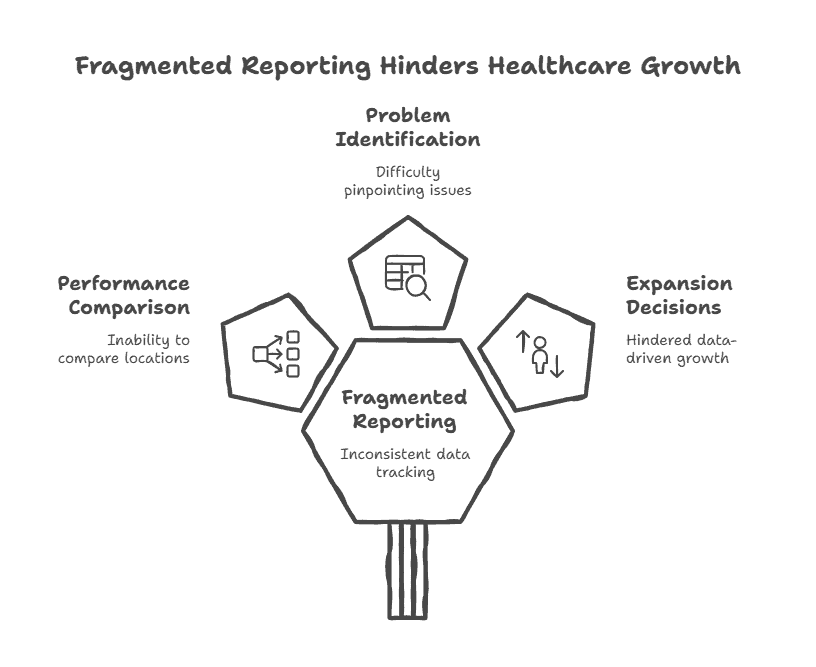
TL;DR: Most multi-location healthcare groups struggle with financial reporting because each location tracks data differently, uses different systems, and reports on different timelines. The result? Leadership can’t compare performance, identify problems, or make data-driven expansion decisions. A unified financial reporting system provides location-level P&Ls, standardized KPIs, and consolidated dashboards—turning chaos into clarity and enabling scalable growth.
The 5 Fatal Flaws of Multi-Location Financial Reporting
1. Inconsistent Chart of Accounts
– Location A calls it “Supplies,” Location B calls it “Consumables”
– No way to compare cost structures
– Consolidation requires manual rework
2. Different Reporting Timelines
– Location 1 closes on the 5th
– Location 2 closes on the 10th
– Location 3 closes “when they get to it”
– Monthly reporting becomes monthly guessing
3. No Standardized KPIs
– Each manager tracks what they think is important
– No apples-to-apples comparison
– Can’t identify best practices or problems
4. Manual Spreadsheet Hell
– Each location has their own Excel masterpiece
– Corporate spends days consolidating
– Errors are inevitable, transparency is impossible
5. No Visibility into Inter-Company Transactions
– Corporate allocations misunderstood or resisted
– Shared services costs allocated inconsistently
– Location managers feel penalized for “corporate overhead”
The solution isn’t more reports—it’s better designed reports.
The 7 Components of Multi-Location Financial Reporting
1. Standardized Chart of Accounts (The Foundation)
2. Location-Level P&L Structure (The Core Report)
3. Consolidated Group View (The Big Picture)
4. KPI Dashboard by Location (The Performance Lens)
5. Inter-Company Allocation Framework (The Fairness Engine)
6. Cash Flow Reporting by Location (The Survival Metric)
7. Monthly Reporting Package (The Communication Tool)
Let’s build this system.
1. Standardized Chart of Accounts: One Language for All Locations
Every location must use the same account structure:
Revenue Accounts:
– 4000 · Injectables Revenue
– 4100 · Laser & Energy-Based Treatments
– 4200 · Skincare & Facials
– 4300 · Medical Visits (if applicable)
– 4400 · Retail Sales
– 4500 · Membership Fees
– 4600 · Package Sales
– 4700 · Other Revenue
Cost of Goods Sold:
– 5000 · Injectables Consumables
– 5100 · Laser Consumables & Tips
– 5200 · Skincare Product Cost
– 5300 · Medical Supplies
– 5400 · Retail Cost of Goods
Operating Expenses (Grouped by Natural Category):
– 6000 · Provider Compensation
– 6100 · Clinical Support Staff
– 6200 · Front Desk & Admin
– 6300 · Rent & Utilities
– 6400 · Marketing & Advertising
– 6500 · Software & Technology
– 6600 · Insurance & Professional Fees
– 6700 · Depreciation & Amortization
– 6800 · Other Operating Expenses
Key principle: Same accounts, same definitions, same coding rules across all locations.
2. Location-Level P&L: The Manager’s Scorecard
Each location gets its own P&L with this structure:
Location P&L Template:
Revenue
– Total Revenue
– By service line (mapped to chart of accounts)
Direct Costs
– Cost of Goods Sold
– By category (matching revenue)
– Direct Labor
– Providers
– Clinical support
Contribution Margin
– Revenue – Direct Costs
– Contribution Margin % (Key metric)
Location Operating Expenses
– Rent & Utilities
– Location Marketing
– Local Staff (non-provider)
– Location-specific software
– Other location costs
Location EBITDA
– Contribution Margin – Location Operating Expenses
– Location EBITDA % (Primary performance metric)
This structure shows: Is this location fundamentally profitable before corporate allocations?
3. Consolidated Group View: The Leadership Dashboard
The consolidated report answers: “How are we doing as a company?”
Consolidated P&L Structure:
Total Group Revenue
– Sum of all location revenue
– Plus any corporate revenue (if applicable)
Total Direct Costs
– Sum of all location direct costs
Total Contribution Margin
– Group-level margin percentage
Corporate Overhead
– Executive salaries
– Centralized marketing
– Finance & accounting
– HR & recruiting
– Corporate technology
– Legal & compliance
Group EBITDA
– The bottom line that matters for valuation and cash flow
4. The KPI Dashboard: Comparing Apples to Apples
Same KPIs, calculated the same way, for every location:
Monthly KPI Dashboard:
| KPI | Location A | Location B | Location C | Group Avg |
|—————————–|—————-|—————-|—————-|—————|
| Revenue | \$450,000 | \$380,000 | \$520,000 | \$450,000 |
| Revenue Growth (YoY) | 18% | 12% | 25% | 18% |
| Contribution Margin % | 62% | 58% | 65% | 62% |
| Location EBITDA % | 24% | 19% | 28% | 24% |
| Revenue/Provider | \$825,000 | \$760,000 | \$865,000 | \$817,000 |
| Revenue/Clinical Hour | \$685 | \$620 | \$720 | \$675 |
| Provider Utilization | 82% | 75% | 85% | 81% |
| New Patient % | 32% | 28% | 35% | 32% |
| Rebooking Rate | 78% | 72% | 82% | 77% |
Color coding: Green = above target, Yellow = at target, Red = below target
5. Inter-Company Allocation Framework: The Fairness Doctrine
Corporate costs must be allocated fairly, or location managers will resist them.
Allocation Methodology:
By Headcount:
– HR costs
– Payroll processing
– Benefits administration
By Revenue:
– Corporate marketing
– Brand development
– Executive leadership (portion)
By Square Footage:
– Corporate office space (if applicable)
By Transaction Volume:
– Billing and collections
– Accounting close support
Transparency is key: Each location should see exactly what they’re being charged and why.
6. Cash Flow Reporting by Location: Who’s Generating Cash?
EBITDA ≠ Cash. Each location needs its own cash flow statement.
Location Cash Flow Statement:
Cash from Operations
– Collections from patients
– Less: Payments to vendors
– Less: Payroll payments
– Less: Rent & utilities
Cash from Financing (if applicable)
– Inter-company loans
– Capital contributions
Cash from Investing (if applicable)
– Location-specific equipment purchases
Net Cash Flow
– Beginning cash + inflows – outflows
Key metric: Cash generated per location, net of all local expenditures.
7. The Monthly Reporting Package: What Goes to Whom
Day 3–5 of Month:
– Location P&Ls finalized
– KPI dashboards updated
– Variance analysis (actual vs. budget)
Day 6:
– Consolidated group report
– Executive summary with key insights
– Red flag identification
Day 7:
– Location manager review meetings
– Action plans for underperforming locations
– Best practice sharing from top performers
Day 8–10:
– Board/ownership report
– Investor update (if applicable)
– Strategic planning inputs
Implementation Roadmap: 90 Days to Better Reporting
Month 1: Standardization
1. Create and distribute standardized chart of accounts
2. Train location managers on new coding
3. Set closing calendar (all locations close by 3rd business day)
Month 2: Implementation
1. First month using new system
2. Identify and fix inconsistencies
3. Create template reports
Month 3: Refinement
1. Add KPI dashboard
2. Implement allocation methodology
3. Train on variance analysis
Month 4+: Optimization
1. Monthly refinement based on feedback
2. Add more sophisticated analytics
3. Integrate with operational systems
Case Study: 6-Location Group Goes from Chaos to Clarity
Before:
– 6 different accounting systems
– Monthly close took 15+ days
– No way to compare location performance
– Constant arguments about corporate allocations
– EBITDA varied wildly by location (8–26%)
After Standardized Reporting:
– Single chart of accounts across all locations
– Monthly close by 3rd business day
– Clear visibility into performance drivers
– Transparent allocation methodology
– EBITDA range narrowed (19–28%)
Results:
– Finance team reduced from 8 to 5 (more efficient)
– Location managers empowered with better data
– Expansion decisions based on clear metrics
– Sold company for 30% higher multiple due to clean financials
Strategic CFO Insights
1. Consistency trumps sophistication in multi-location reporting.
2. Location managers should see their P&L before corporate allocations.
3. The same KPIs calculated the same way enable true comparison.
4. Transparency in allocations eliminates resistance to corporate costs.
5. Monthly reporting is a process, not an event—build the rhythm.
FAQ
1. Should all locations use the same accounting software?
Ideally yes, but not absolutely necessary. What matters is same chart of accounts and same reporting outputs.
2. How do we handle locations at different maturity levels?
Segment reporting:
– New locations (<12 months): Focus on ramp metrics, not absolute profitability
– Mature locations: Full P&L with profitability targets
– Transition at 12–18 months to mature reporting
3. What if a location manager doesn’t understand the financials?
Training is essential. Monthly review meetings should include 15–30 minutes of financial education. Start with 3–5 key metrics they can influence.
